Log to Azure's Application Insights
You can configure Identify to log to Azure's Application Insights and use its rich monitoring capacity to monitor many of Identify's activities.
Enable Application Insights
To log data to Application Insights, you need to do the following steps:
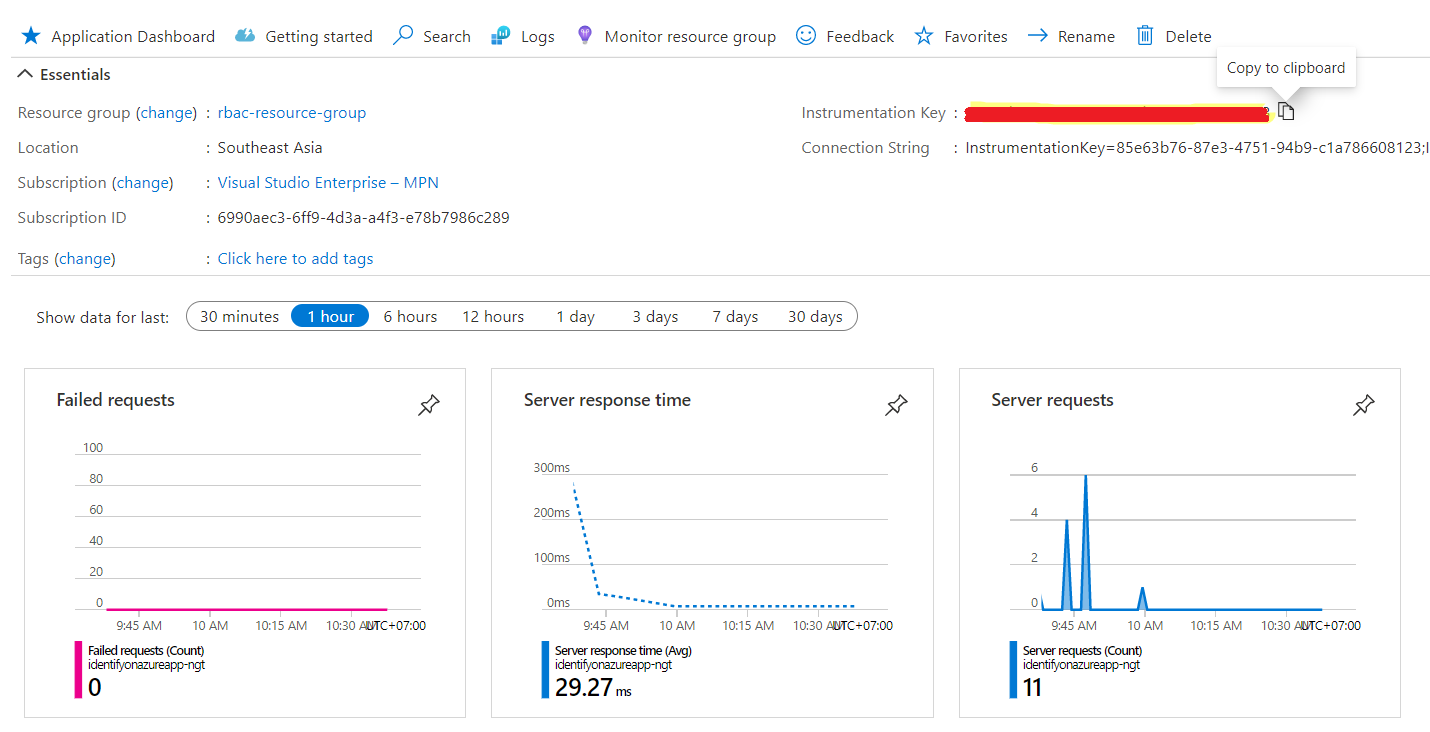
- Create and set up your Application Insights account.
- You can use either the Instrumentation Key or the Connection string to configure logging to Application Insights. In the example below, the Instrumentation Key setting is used.
- Enable the Log target setting for Application Insights:
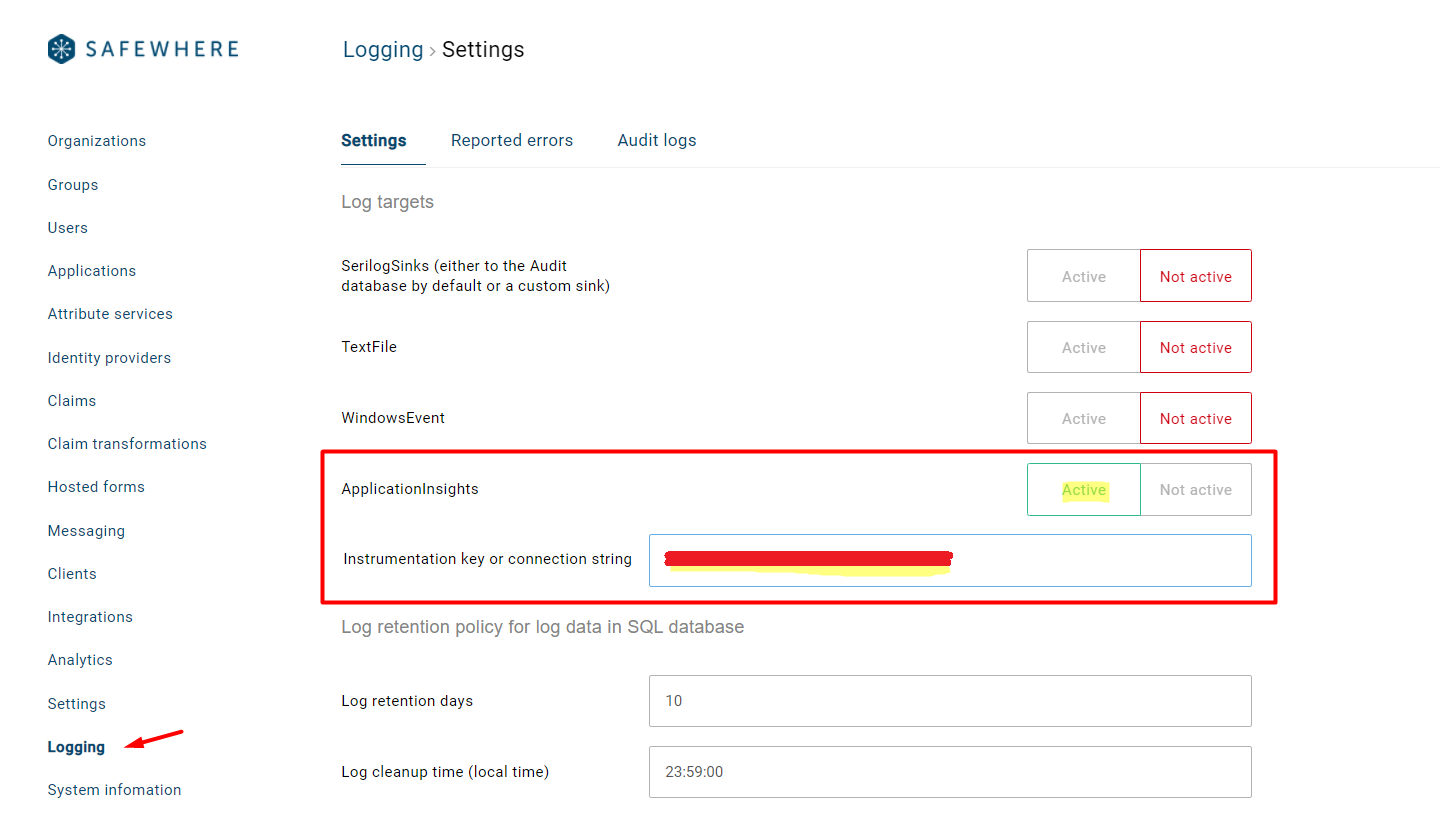
- Save your changes.
Monitoring
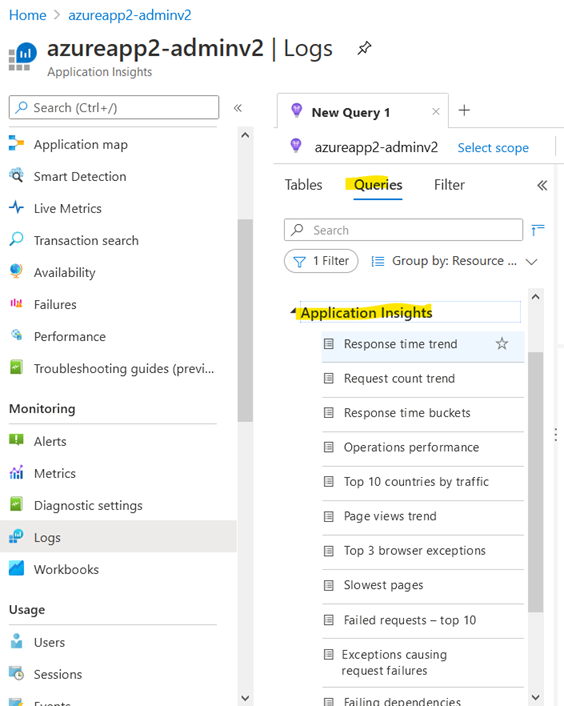
Application Insights has some built-in queries that are very useful for learning how it works. Upcoming sections explain how to set up a dashboard and what each metric does. You can in fact use the Identify dashboard - Identify specific metrics - template.json to create a dashboard.
Response time (latency)
When it comes to performance, the most important activities to measure in Identify are throughput and latency.
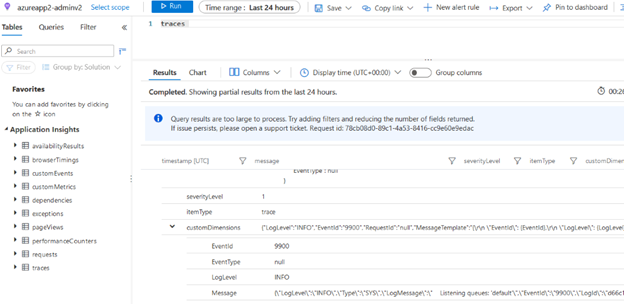
When pushing Identify’s logs to Application Insights using Serilog, data is stored in the traces collection:
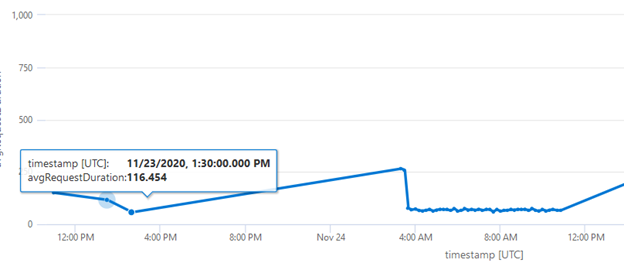
Query to monitor average response time
// Response time trend

// Chart request duration over the last 7 days hours.

requests

| where timestamp > ago(7d) and (name == "GET PlugIn/Resolve" or name == "POST PlugIn/Resolve") and duration < 2000

| summarize avgRequestDuration=avg(duration) by bin(timestamp, 10m) // use a time grain of 10 minutes

| render timechart
Query to monitor response bucket
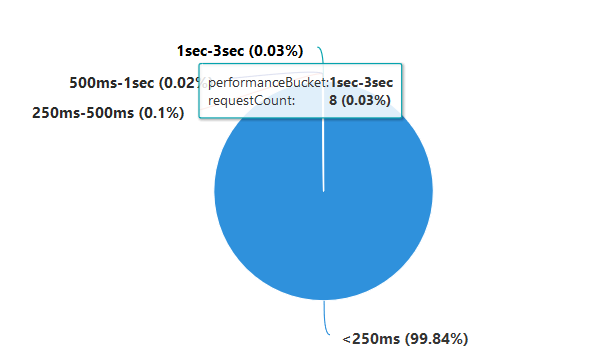
Pie chart (good for showing percentages)
// Response time buckets

// Show how many requests are in each performance-bucket.

requests

| where timestamp > ago(7d) and (name == "GET PlugIn/Resolve" or name == "POST PlugIn/Resolve")

| summarize requestCount=sum(itemCount), avgDuration=avg(duration) by performanceBucket

| order by avgDuration asc // sort by average request duration

| project-away avgDuration // no need to display avgDuration, we used it only for sorting results

| render piechart
If you want to have 99% of all logins done in less than 1 second, approximately 99% of all requests must be in the 250ms bucket because a typical login needs 4 web requests.
Bar chart (good for showing total numbers)
// Response time buckets

// Show how many requests are in each performance-bucket.

requests

| where timestamp > ago(7d) and (name == "GET PlugIn/Resolve" or name == "POST PlugIn/Resolve")

| summarize requestCount=sum(itemCount), avgDuration=avg(duration) by performanceBucket

| order by avgDuration asc // sort by average request duration

| project-away avgDuration // no need to display avgDuration, we used it only for sorting results

| render barchart

Failed requests
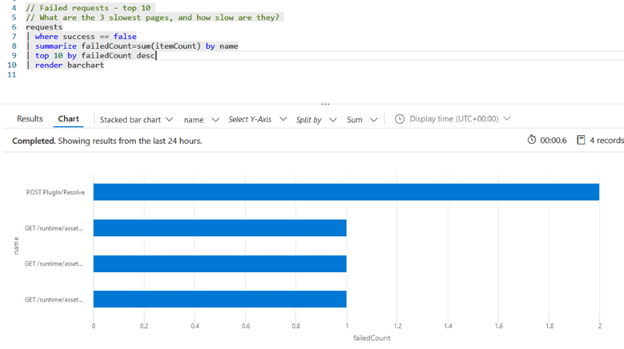
Query to count total failed requests
// Failed requests – top 10

// What are the 3 slowest pages and how slow are they?

requests

| where timestamp > ago(7d) and success == false

| summarize failedCount=sum(itemCount) by name

| top 10 by failedCount desc

| render barchart
Query to find all exceptions causing request failures
// Exceptions causing request failures

// Find the exceptation that led to failed requests in the past hour.

requests

| where timestamp > ago(14d) and success == false

| join kind= inner (

exceptions

| where timestamp > ago(14d)

) on operation_Id

| project exceptionType = type, failedMethod = method, requestName = name, requestDuration = duration
Monitoring some specific errors (context id)
Query to count total failed requests every 30 minutes that relate to context id:
traces

| where timestamp > ago(14d) and customDimensions.LogLevel == "ERROR" and customDimensions.Message contains "InvalidContextException"

| summarize totalCount=sum(itemCount) by bin(timestamp, 30m)

| render timechart