Diagnostic and monitoring tool
Overview
The diagnostic and monitoring application, also known as DiagMon, is a simple and convenient tool that helps you monitor and diagnose issues related to your Safewhere Identify instances.
This tool can collect important information from your databases, such as space usage by schema and table, as well as reports on missing indexes and index deviations. It can also monitor your Identify tenants, including signing certificate expiration dates, logging settings, and second-factor configuration. If it detects any problems, it provides warnings and useful information.
You can use this tool in different ways, depending on your preference and situation. You can run it as a console tool and specify which profile to use. Alternatively, you can run it as an Azure Function and configure a timer trigger for automatic, periodic execution.
Read the sections below for more details on how to use our tool for your Safewhere Identify instances.
Functionalities
The Diagnostic tool includes two primary functionalities, providing flexibility when monitoring and diagnosing your Identify instance. The REST API functionality provides comprehensive visibility into instance data and configuration, while the database functionality provides in-depth insight at the database level.
Rest API functionalities
Signing certificate diagnostics
- Command name:
SigningCertificate. - This command monitors signing certificate expiration and returns a comprehensive report that includes the expiration date (in UTC) and additional details.
- Return status:
- Normal: If the certificate has more than 1 month before expiration.
- Warning: If the certificate has less than 1 month but more than 2 weeks before expiration.
- Critical: If the certificate has less than 2 weeks before expiration, or if the signing certificate is not found in the certificate list (that is, not found in the database).
Logging settings diagnostics
- Command name:
LoggingSettings. - This command inspects the logging settings. If any setting is configured to debug or verbose, it triggers a warning; otherwise, it reports as normal.
Admin connection setup diagnostics
- Command name:
AdminConnectionSetup. - This command assesses whether the Username & Password connection configured to log in to the Admin interface has a second factor configured. It reports the second factor connection name and issues a warning if it is absent.
Database functionalities
Database diagnostics
- Command name:
DatabaseDiagnostics. - This command executes all scripts configured in the SqlQueriesToRun list:
- db_query_DatabaseSize.sql: Provides information about the disk space utilization of tables and indices in a database (such as the Identify or IdentifyAudit database).
- db_query_IdentifyIndex.sql: Retrieves information about indices of all schemas in a database.
- db_query_IdentifyTableSize.sql: Retrieves information about the size of tables across all schemas in a database.
- db_query_systemsetup.sql: Retrieves information about Identify's System settings.
- Scripts starting with "schema_query" are selectively executed on schemas configured in the SchemasToRun list:
- schema_query_IdentifyIndex.sql: Retrieves information about the indices of a specific schema in a database.
- schema_query_IdentifyTableSize.sql: Retrieves information about the storage space of a specific schema in a database.
Database non-query
- Command name:
DatabaseNonQuery. - This command executes all scripts starting with "schema_command" configured in the IdentifyInstanceOptions.SqlCommandsToRun list. It is typically used to clean up specific instances, especially in cloud environments where SQL Agent is not available, optimizing operational costs.
- schema_command_AuditLogsCleanUp.sql: Cleans up logs stored in the [Logs] table of a specific schema in the [IdentifyAudit] database.
- schema_command_AuditOauthAccessTokenCleanUp.sql: Cleans up data in two related tables (AuditOauthAccessToken and AuditEvent) of a specific schema in the [IdentifyAudit] database.
- schema_command_OauthAccessTokenCleanUp.sql: Cleans up data in the [OauthAccessToken] table of a specific schema in the [Identify] database.
Index diagnostics
- Command Name:
IndexDiagnostics. - This command performs diagnostics on indices of an Identify instance, reporting missing indices and deviations from the standard existing indices.
Detect custom columns
- Command Name:
DetectCustomColumnsCommand. - This command detects columns with names that contain the prefix "Cust_" (case-sensitive).
- This command executes the following script:
- schema_query_CustomColumns.sql: Retrieves information about column names that contain the prefix "Cust_" (case-sensitive) of a specific table schema.
Detect tenant version mismatch
- Command name:
DetectTenantVersionMisMatch. - This command detects version mismatches between a primary tenant and its replicate tenants in the IdentifyTenant database, helping you identify version inconsistencies across tenants.
Potential upgrade problems
- Command Name:
PotentialUpgradeIssue. - This composite command thoroughly scans all schemas in the database. It starts by executing the 'IndexDiagnosticsCommand' to gather crucial data related to missing or non-standard indices within the database. Subsequently, it conducts a table size analysis by executing 'DiagnosticsOversized', providing information on the number of rows for problematic tables. Finally, it runs the 'DetectCustomColumnsCommand' to report all tables whose names contain "Cust_" (case-sensitive).
Guidelines to configure and execute the diagnostic tool
General settings explanation
The diagnostic and monitoring tool offers several commands and SQL scripts to retrieve or clean up data in Identify databases. CompositeOptions is configured to run the Diagnostics and Monitoring tool on demand and contains multiple instances of IdentifyEnvironmentOptions and IdentifyRestApiOptions.
Example: appsettings.json
{
  "Serilog": {
    "Using": [
      "Serilog.Sinks.Console",
      "Serilog.Sinks.File",
      "Serilog.Sinks.ApplicationInsights"
    ],
    "MinimumLevel": "Verbose",
    "WriteTo": [
      {
        "Name": "ApplicationInsights",
        "Args": {
          "connectionString": "#APPLICATION_INSIGHTS_CONNECTION_STRING",
          "telemetryConverter": "Serilog.Sinks.ApplicationInsights.TelemetryConverters.TraceTelemetryConverter, Serilog.Sinks.ApplicationInsights"
        }
      },
      {
        "Name": "Console",
        "Args": {
          "outputTemplate": "{Message:l}{NewLine}{Exception}"
        }
      },
      {
        "Name": "File",
        "Args": {
          "path": "Logs/log-information.json",
          "rollingInterval": "Day",
          "outputTemplate": "{Message:l}{NewLine}{Exception}",
          "restrictedToMinimumLevel": "Information"
        }
      },
      {
        "Name": "File",
        "Args": {
          "path": "Logs/log-warning.json",
          "rollingInterval": "Day",
          "outputTemplate": "{Message:l}{NewLine}{Exception}",
          "restrictedToMinimumLevel": "Warning"
        }
      },
      {
        "Name": "File",
        "Args": {
          "path": "Logs/log-error.json",
          "rollingInterval": "Day",
          "outputTemplate": "{Message:l}{NewLine}{Exception}",
          "restrictedToMinimumLevel": "Error"
        }
      },
      {
        "Name": "File",
        "Args": {
          "path": "Logs/log-debug.json",
          "rollingInterval": "Day",
          "outputTemplate": "{Message:l}{NewLine}{Exception}",
          "restrictedToMinimumLevel": "Debug"
        }
      }
    ],
    "Enrich": [ "FromLogContext" ]
  },
  "AllowedHosts": "*",
  "CompositeOptions": {
    "IdentifyEnvironmentOptions": [
      {
        //SQL Authentication
        // SQL Authentication - If Safewhere is configured with an SQL Cluster, the MultipleActiveResultSets value must be set to True.
        "DatabaseConnectionString": "Server=#SERVER_NAME;Database=Identify;uid=#USER_ID;pwd=#PASSWORD;MultipleActiveResultSets=true;MultiSubnetFailover=False;Encrypt=False;",
        "ConnectionName": "Identify",
        "DiagnosticsToRun": [ "DatabaseDiagnostics" ],
        "SqlQueriesToRun": [ "db_query_DatabaseSize.sql" ],
        "SchemasToRun": [ "identify01" ],
        "ComparisonTargetVersion": "5.15", //The target version used for data comparison across different tenants
        "DiagnosticsOversized": {
          "MaxTableSizeInMB": 1000,
          "MaxTableRows": 500
        },
        "IdentifyInstanceOptions": [
          {
            "Schema": "identify01",
            "SqlCommandsToRun": [
              {
                "Command": "schema_command_OauthAccessTokenCleanUp.sql"
              }
            ]
          }
        ]
      },
      {
        // Windows Authentication - If Safewhere is configured with an SQL Cluster, the MultipleActiveResultSets value must be set to True.
        "DatabaseConnectionString": "Server=#SERVER_NAME; Database=IdentifyAudit; Trusted_Connection=True; MultipleActiveResultSets=true;MultiSubnetFailover=False;Encrypt=False;",
        "SqlQueriesToRun": ["db_query_DatabaseSize.sql", "schema_query_IdentifyIndex.sql", "db_query_IdentifyTableSize.sql"],
        "SchemasToRun": ["identify02"],
        "ComparisonTargetVersion": "5.16"
        "ConnectionName": "IdentifyAudit",
        "DiagnosticsToRun": ["DatabaseNonQuery", "DatabaseDiagnostics", "PotentialUpgradeIssue"],
        "DiagnosticsOversized": {
          "MaxTableSizeInMB": 1000,
          "MaxTableRows": 500
        }
      }
    ],
    "IdentifyRestApiOptions": [
      {
        "BaseUrl": "https://identify01.safewhere.local/",
        "RefreshToken": "#REFRESH_TOKEN",
        "ClientId": "#CLIENT_ID",
        "ClientSecret": "#CLIENT_SECRET",
        "Version": "5.15"
      }
    ],
    "ServerWideOptions": {
      "RunRestApiDiagnostics": false,
      "DatabaseServer": "",
      "DatabaseLoginUserName": "",
      "DatabaseLoginUserPassword": ""
    },
    "SecureSensitiveProperty": []
  }
}
IdentifyEnvironmentOptions configuration
A list of options that includes commands or queries that can be run on the entire database or multiple schemas.
- DatabaseConnectionString: Specifies the connection string to connect to the database server. Running queries only requires read access, while running commands to make changes to the database requires write access. Refer to the Database user permissions section for details on assigning necessary permissions to the user.
- ConnectionName: Specifies the name of the database connection.
- SqlQueriesToRun: Specifies the list of all queries that the
DatabaseDiagnosticsneeds to run. - SchemasToRun: Specifies the schemas for which scripts need to be run.
- ComparisonTargetVersion: Specifies the target version (from 5.15) used for data comparison across different tenants.
- DiagnosticsToRun: Specifies the list of all diagnostics and commands to run (refer to the list of command names above).
- IdentifyInstanceOptions: Specifies the list of all commands that can be run on the entire database or multiple schemas.
- Schema: Specifies the schema for which the command needs to be run.
- SqlCommandsToRun: Specifies the commands (which make changes to data) to run for this specific schema. Each command has the following settings:
- Command: Specifies the SQL script for the command.
- BatchSize: Specifies the batch size of the command if it processes data in batches.
- CommandTimeoutInSeconds: Specifies the maximum time to run the command.
- MaxEvents: Specifies the maximum number of rows to run the command on.
- For example, putting all parameters into action, you can configure a cleanup command to delete a maximum of 1 million rows in batches of 10,000 rows each time it runs, and the command can run for a maximum of 20 minutes.
- DiagnosticsOversized: Represents the maximum allowable number of rows and maximum table size for tables.
- MaxTableSizeInMB: Specifies the maximum table size. Only tables whose sizes are larger than this setting are reported.
- MaxTableRows: Specifies the maximum allowable number of rows. Only tables that have more rows than this setting are reported.
Note:
- For scripts that start with "schema_" and for the "IndexDiagnostics", "DetectOversized" or "DetectCustomColumnsCommand" commands, it is necessary to include the "SchemasToRun" setting.
- For the "PotentialUpgradeIssue" and "DetectOversized" commands, it is necessary to include the "DiagnosticsOversized" setting.
IdentifyRestApiOptions configuration
IdentifyRestApiOptions specifies a list of settings that contain instance information for the REST API. To configure it, ensure you have all required values for IdentifyRestApiOptions.
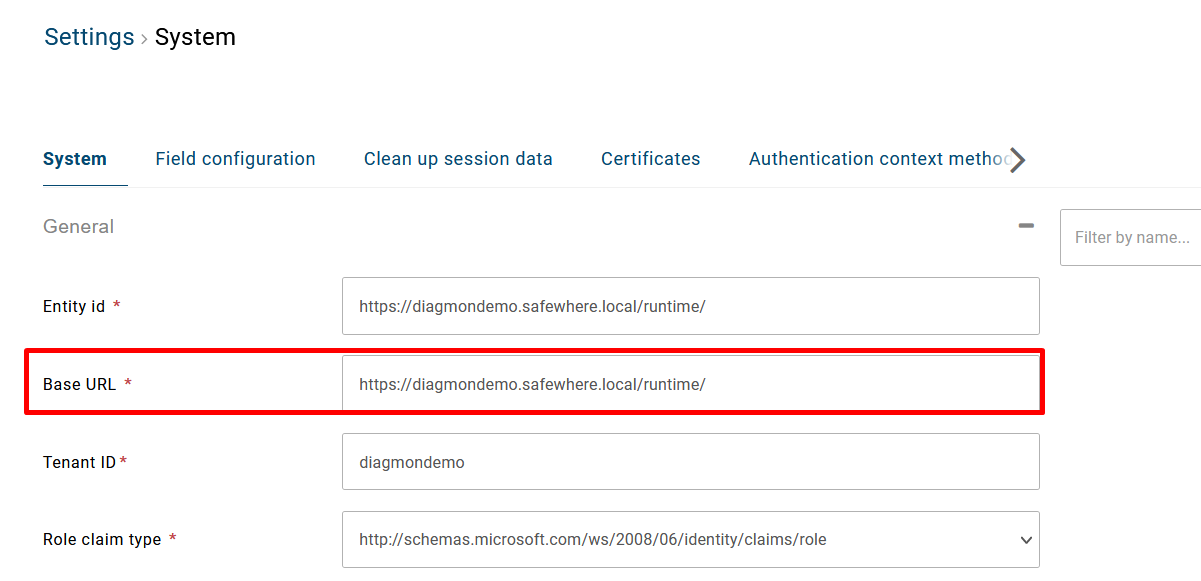
- BaseUrl: The URL of your instance.
- Version: Version of your tenant.
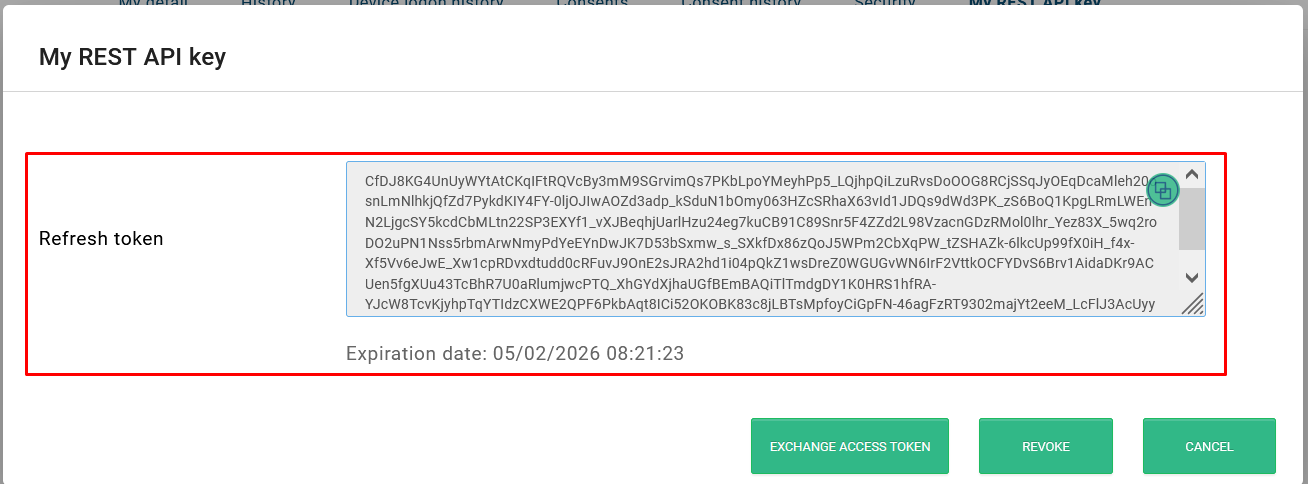
- RefreshToken: This is the refresh token obtained from My REST API key.
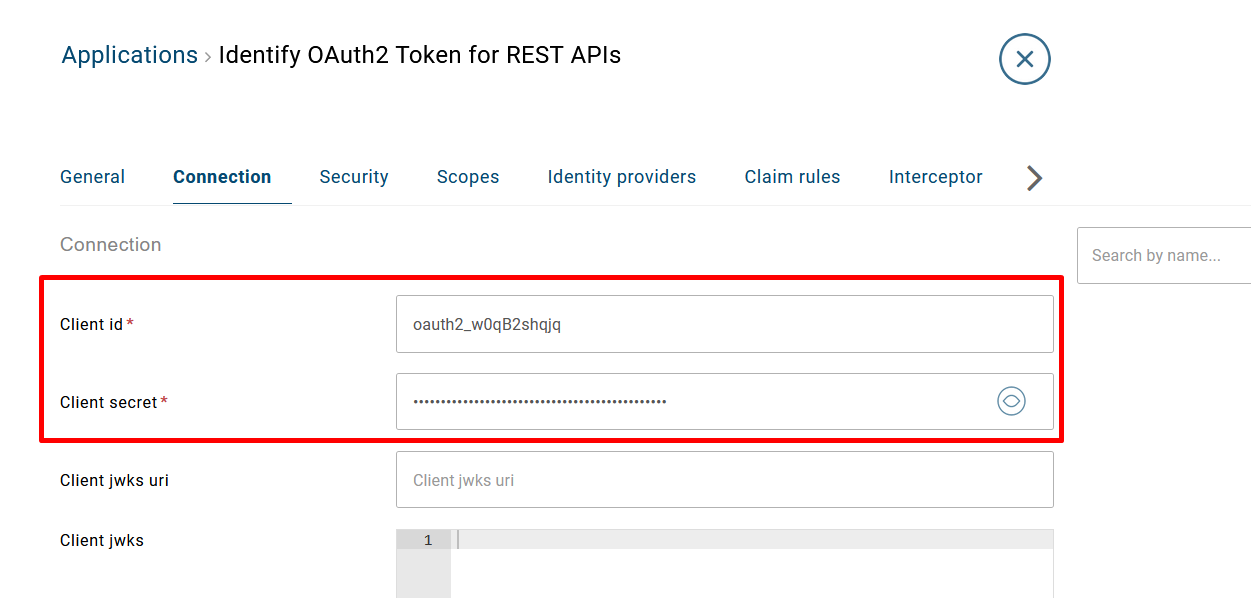
- ClientId: This is the client ID of the Identify OAuth2 Token for REST APIs application.
- ClientSecret: This is the client secret of the Identify OAuth2 Token for REST APIs application.
Example:
"IdentifyRestApiOptions": [
    {
        "BaseUrl": "https://diagmondemo.safewhere.local/",
        "Version": "5.15",
        "RefreshToken": "ery1ywwO6t",
        "ClientId": "oauth2_w0qB2shqjq",
        "ClientSecret": "oauth2_w0qcbddwhqjq",
    }
]
ServerWideOptions configuration
This configuration enables the DiagMon tool to run REST API diagnostics for all tenants in the SQL database server. Use this configuration instead of IdentifyRestApiOptions when performing diagnostics at the server level.
| Name | Data type | Required? | Default value |
|---|---|---|---|
| RunRestApiDiagnostics | boolean | false | false |
| DatabaseServer | string | false | localhost |
| DatabaseLoginUserName | string | false | |
| DatabaseLoginUserPassword | string | false |
- RunRestApiDiagnostics: When set to
true, this option disablesIdentifyRestApiOptionsand runs REST API diagnostics for tenants using server-wide settings. - DatabaseServer: The SQL database server hosts the Identify databases. You can set a custom value or leave it empty to use the default value, which is
localhost. - DatabaseLoginUserName and DatabaseLoginUserPassword: The SQL credentials to access the database server.
Example:
"ServerWideOptions": {
      "RunRestApiDiagnostics": true,
      "DatabaseServer": "ADSserver\\identifyserver01",
      "DatabaseLoginUserName": "sqladmin",
      "DatabaseLoginUserPassword": "Dummypassword"
    }
If you want to log in to the database using Windows Authentication mode, specify only DatabaseServer, then remove DatabaseLoginUserName and DatabaseLoginUserPassword.
Example:
"ServerWideOptions": {
      "RunRestApiDiagnostics": true,
      "DatabaseServer": "ADSserver\\identifyserver01"
    }
Prerequisites for each tenant
- The
Identify OAuth2 Token for REST APIsapplication must exist on the Identify tenant, allowing the DiagMon tool to extract theclient_idandclient_secret. - The Identify user (with the
protectedfield set to 1) must have a valid registered refresh token (the most recent one that has not expired), enabling the DiagMon tool to extract the latest refresh token.
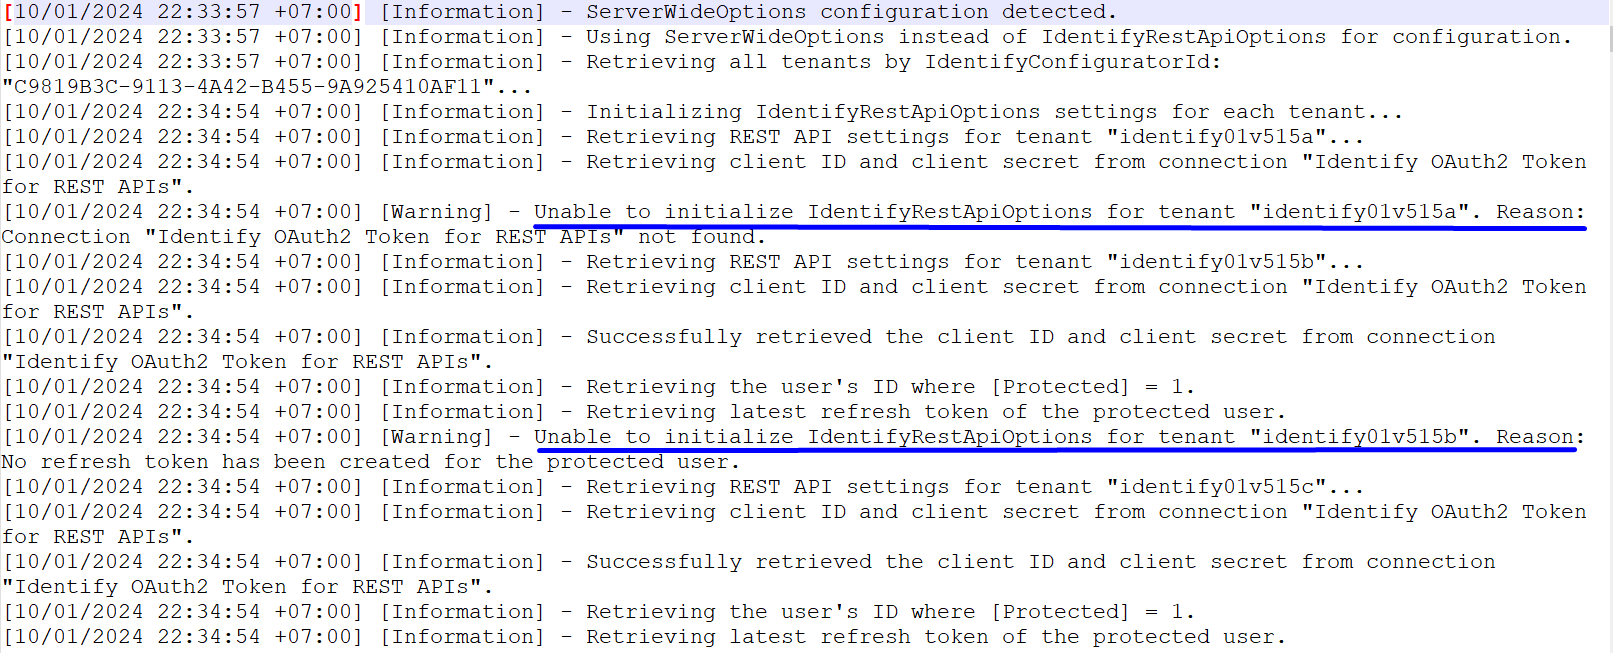
If the above prerequisites are not met, the REST API diagnostics cannot be executed for those tenants. You can find error details by searching for Unable to initialize IdentifyRestApiOptions for tenant in the DiagMon log file after the run is complete.
Logging configuration
The logging configuration, specifically the Serilog section, is set up to write diagnostic and monitoring log values.
- Create a JSON settings configuration file.
{
  "Serilog": {
    "Using": [],
    "MinimumLevel": "Verbose",
    "WriteTo": [],
    "Enrich": ["FromLogContext"]
  }
}
We have 3 options for logging:
Write to Console
Using Serilog.Sinks.Console
Add to Serilog:WriteTo
{
    "Name": "Console"
},
Example:
{
  "Serilog": {
    "Using": ["Serilog.Sinks.Console"],
    "MinimumLevel": "Information",
    "WriteTo": [
      {
        "Name": "Console",
        "Args": {
          "outputTemplate": "{Message:l}{NewLine}{Exception}"
        }
      }
    ],
    "Enrich": ["FromLogContext"]
  }
}
Write to File
Using Serilog.Sinks.File
Add to Serilog:WriteTo
{
    "Name": "File",
    "Args": {
        "path": "{your_local_logging_path}",
        "rollingInterval": "Day",
        "outputTemplate": "{Message:l}{NewLine}{Exception}",
        "restrictedToMinimumLevel": "Information"
    }
},
{
    "Name": "File",
    "Args": {
        "path": "{your_local_logging_path}",
        "rollingInterval": "Day",
        "outputTemplate": "{Message:l}{NewLine}{Exception}",
        "restrictedToMinimumLevel": "Warning"
    }
},
{
    "Name": "File",
    "Args": {
        "path": "{your_local_logging_path}",
        "rollingInterval": "Day",
        "outputTemplate": "{Message:l}{NewLine}{Exception}",
        "restrictedToMinimumLevel": "Error"
    }
},
{
    "Name": "File",
    "Args": {
        "path": "{your_local_logging_path}",
        "rollingInterval": "Day",
        "outputTemplate": "{Message:l}{NewLine}{Exception}",
        "restrictedToMinimumLevel": "Debug"
    }
}
Note: {your_local_logging_path} is a path to save a log file matching MinimumLevel (Information, Warning, Error)
Example:
{
    "Serilog": {
        "Using": [
            "Serilog.Sinks.File",
        ],
        "MinimumLevel": "Information",
        "WriteTo": [
            {
                "Name": "File",
                "Args": {
                "path": "Logs/log-information.json",
                "rollingInterval": "Day",
                "outputTemplate": "{Message:l}{NewLine}{Exception}",
                "restrictedToMinimumLevel": "Information"
                }
            },
            {
                "Name": "File",
                "Args": {
                "path": "Logs/log-warning.json",
                "rollingInterval": "Day",
                "outputTemplate": "{Message:l}{NewLine}{Exception}",
                "restrictedToMinimumLevel": "Warning"
                }
            },
            {
                "Name": "File",
                "Args": {
                "path": "Logs/log-error.json",
                "rollingInterval": "Day",
                "outputTemplate": "{Message:l}{NewLine}{Exception}",
                "restrictedToMinimumLevel": "Error"
                }
            },
            {
                "Name": "File",
                "Args": {
                "path": "Logs/log-debug.json",
                "rollingInterval": "Day",
                "outputTemplate": "{Message:l}{NewLine}{Exception}",
                "restrictedToMinimumLevel": "Debug"
                }
            }
        ],
        "Enrich": [ "FromLogContext" ]
    }
}
Write to Application Insights
Using *Serilog.Sinks.ApplicationInsights*

Serilog:WriteTo add

```json
{
    "Name": "ApplicationInsights",
    "Args": {
        "connectionString": "{your_connection_string}",
        "telemetryConverter": "Serilog.Sinks.ApplicationInsights.TelemetryConverters.TraceTelemetryConverter, Serilog.Sinks.ApplicationInsights"
    }
}
```

Note: *{your_connection_string}* click [here](https://learn.microsoft.com/en-us/azure/azure-monitor/app/sdk-connection-string) for how to get your Application Insights connection string

Example:

```json
{
    "Serilog": {
        "Using": [
            "Serilog.Sinks.ApplicationInsights",
        ],
        "MinimumLevel": "Information",
        "WriteTo": [
            {
                "Name": "ApplicationInsights",
                "Args": {
                "connectionString": "xxx",
                "telemetryConverter": "Serilog.Sinks.ApplicationInsights.TelemetryConverters.TraceTelemetryConverter, Serilog.Sinks.ApplicationInsights"
                }
            },
        ],
        "Enrich": [ "FromLogContext" ]
    }
}
```
Configure and execute diagnostic tool on console
Configure the appsettings file
The Console tool reads from a JSON configuration file. There are multiple preset configuration files named appsettings.<profile_name>.json, where <profile_name> is your specific configuration name. <profile_name> is optional, so if you leave it empty, the tool uses the default profile appsettings.json.
Database user permissions
To execute tools, a database user requires at least two roles: db_datareader and db_datawriter in both Identify and IdentifyAudit databases. This applies to both Azure SQL Server and on-premises SQL Server.
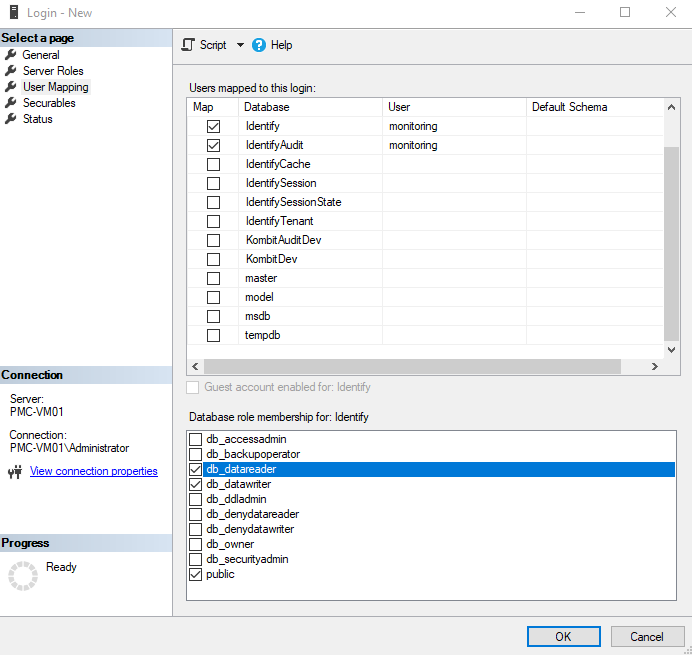
db_datareader: This role is necessary for reading data from the database. It allows the user to execute SELECT queries on the tables in the database, crucial for any tool that needs to fetch and read data.
db_datawriter: This role allows the user to modify the data in the database. It includes permissions to execute INSERT, UPDATE, and DELETE queries, necessary for any tool that needs to update data, insert new data, or delete existing data.
To assign these roles, you can use SQL commands. Here's an example for the Identify database:
USE Identify
EXEC sp_addrolemember 'db_datareader', '<user_name>'
EXEC sp_addrolemember 'db_datawriter', '<user_name>'
Execute tool on console
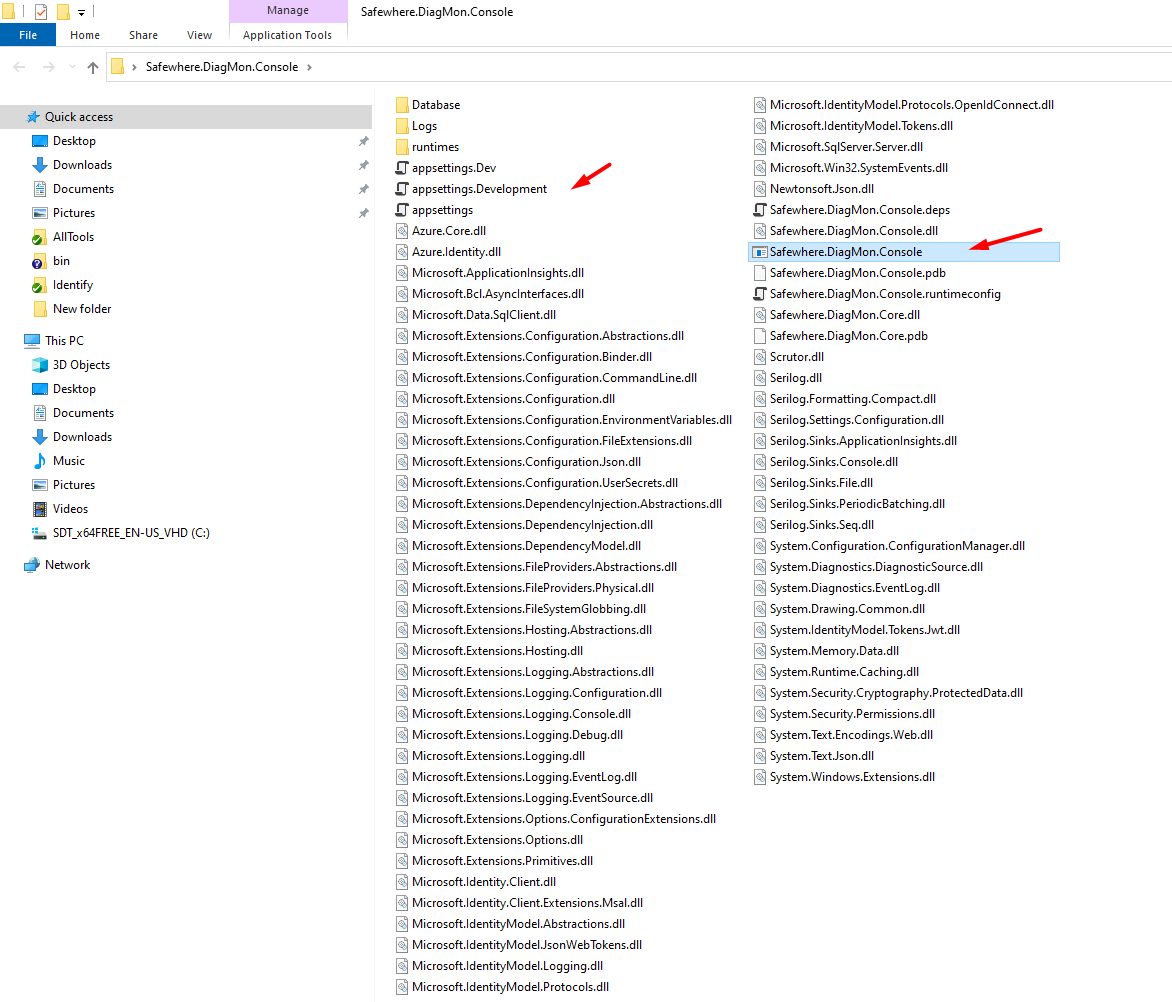
Navigate to download site, and select DiagMon to download the application. Choose DiagMon-Console if you intend to execute the tool on the console.
Create your preset file in the current folder using this naming pattern: appsettings.<profile_name>.json (<profile_name> is the name of your configuration file).
Note: Default profile is appsettings.json
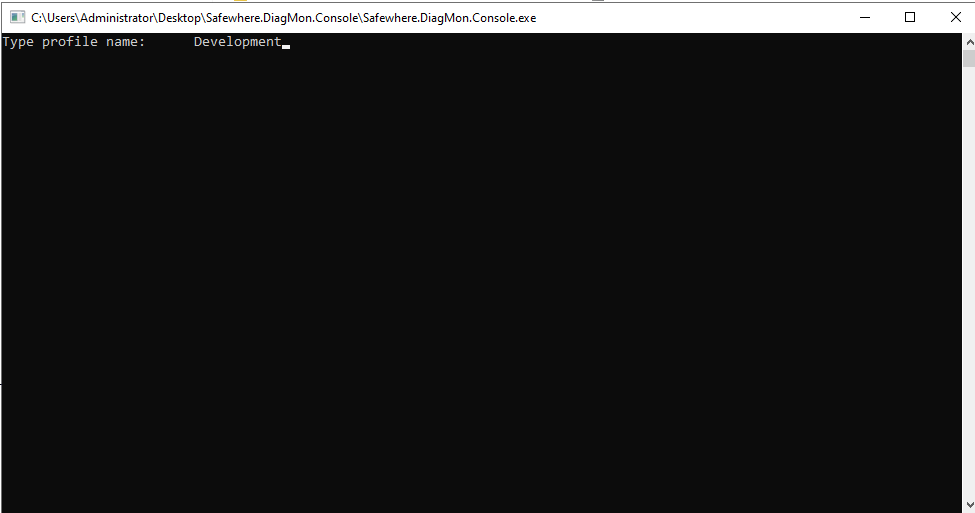
Double-click Safewhere.DiagMon.Console.exe to execute the Console tool.
Enter the name of the configuration file you want to diagnose as <profile_name>, and wait for the results. If <profile_name> is empty or not provided, the tool will run with the default profile.
Run with command line arguments
To use the Safewhere.DiagMon.Console.exe tool with the --profile argument, follow these steps:
Open a terminal or Command Prompt.
Navigate to the tool's directory
Use the cd command to navigate to the directory where Safewhere.DiagMon.Console.exe is located. Replace path/to/Safewhere.DiagMon.Console.exe with the actual path on your system.
cd path/to/Safewhere.DiagMon.Console.exe
- Run the tool with a profile:
Execute the tool with the desired profile using the following command:
Safewhere.DiagMon.Console.exe --profile <profile_name>
Replace <profile_name> with the name of the profile you want to use. If <profile_name> is empty or not provided, the tool will run with the default profile.
Examples:
Run with a specific profile:
Safewhere.DiagMon.Console.exe --profile DevelopmentRun with the default profile:
Safewhere.DiagMon.Console.exe
Configure and execute diagnostic tool on Azure Function
If you do not have a Function App in your Azure Portal, click here to create one.
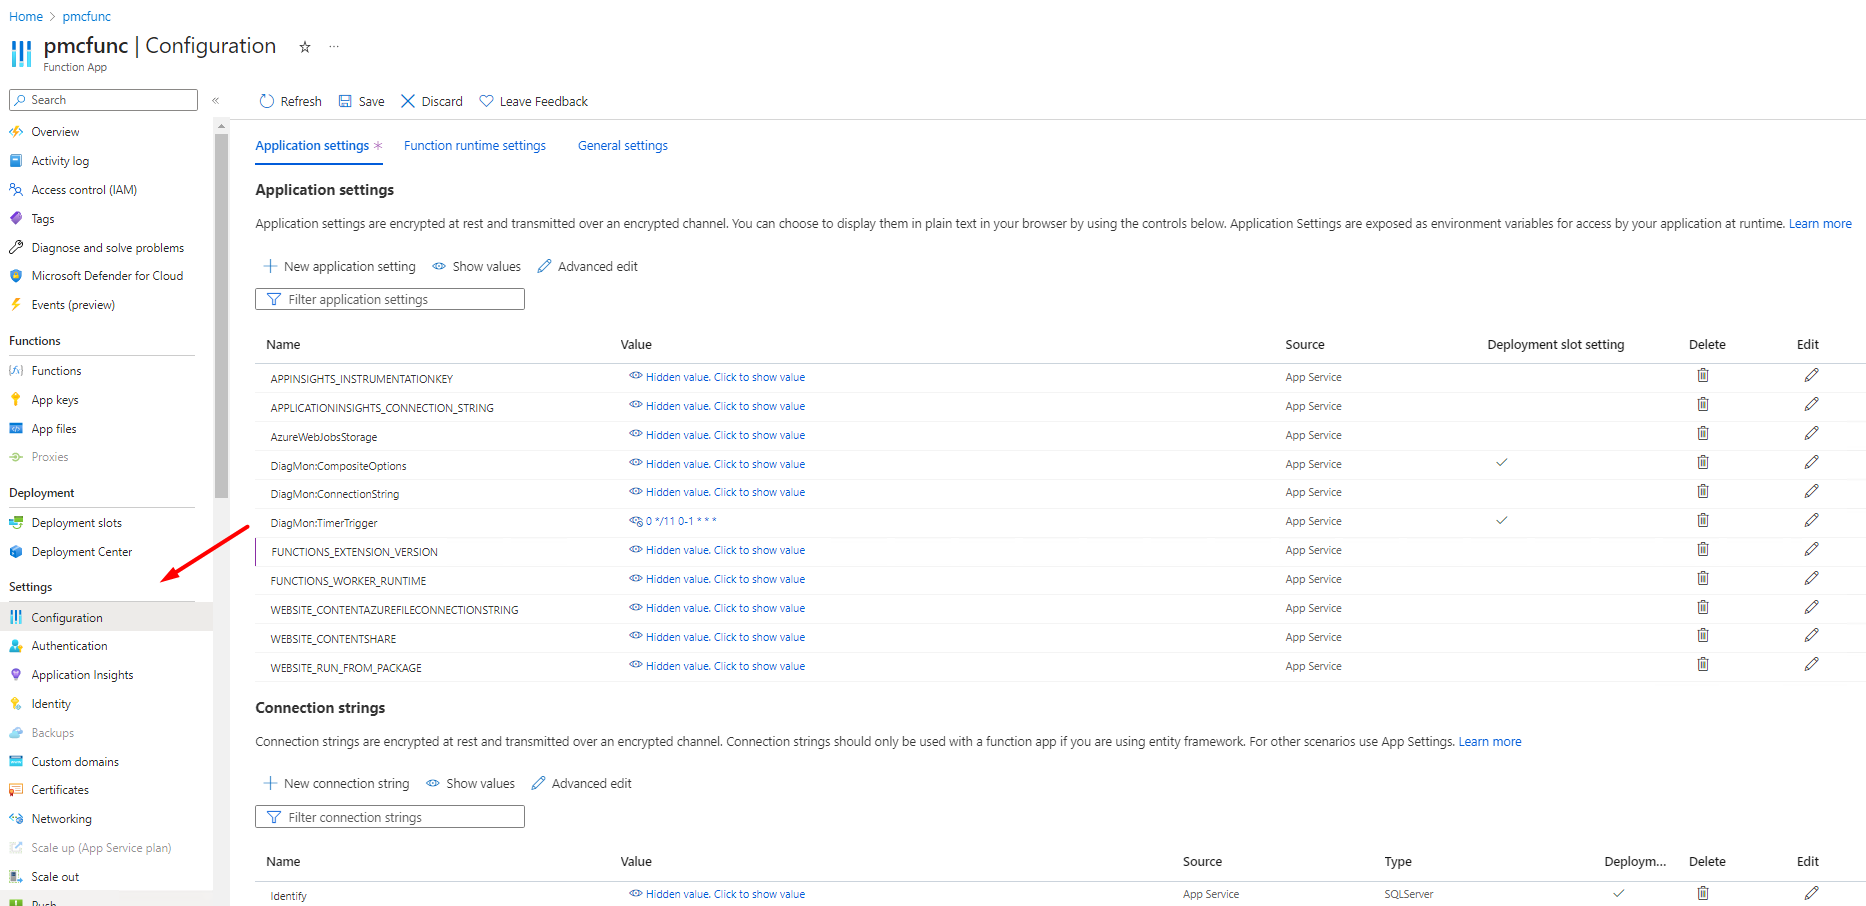
Configure on Azure Function
The Azure Function reads the tool's settings from its configuration. If a setting is not configured there, the tool reads from appsettings by default.
Follow these steps to configure Diagnostic tool on Azure Function:
Step 1: Create a JSON configuration for CompositeOptions with your desired configuration options.
Example:
{
    "CompositeOptions": {
        "IdentifyEnvironmentOptions": [
            {
                "DatabaseConnectionString": "Server=localhost; Database=Identify; uid=dev; pwd={your_password} ; MultipleActiveResultSets=true;MultiSubnetFailover=False;TrustServerCertificate=True;",
                "SqlQueriesToRun": [ "db_query_DatabaseSize.sql", "schema_query_IdentifyIndex.sql", "db_query_IdentifyTableSize.sql" ],
                "SchemasToRun": [ "identify01", "identify02" ],
                "ConnectionName": "Identify",
                "DiagnosticsToRun": [ "DatabaseNonQuery", "DatabaseDiagnostics" ]
            }
        ],
        "IdentifyRestApiOptions": [
            {
                "BaseUrl": "https://dev.safewhere.local/",
                "Version": "5.15.102",
                "RefreshToken": "ery1ywwO6t",
                "ClientId": "w0qB2shqjq",
                "ClientSecret": "sffershqjq",
            }
        ]
    }
}
Step 2: Encode the JSON configuration created in Step 1 using Base64.
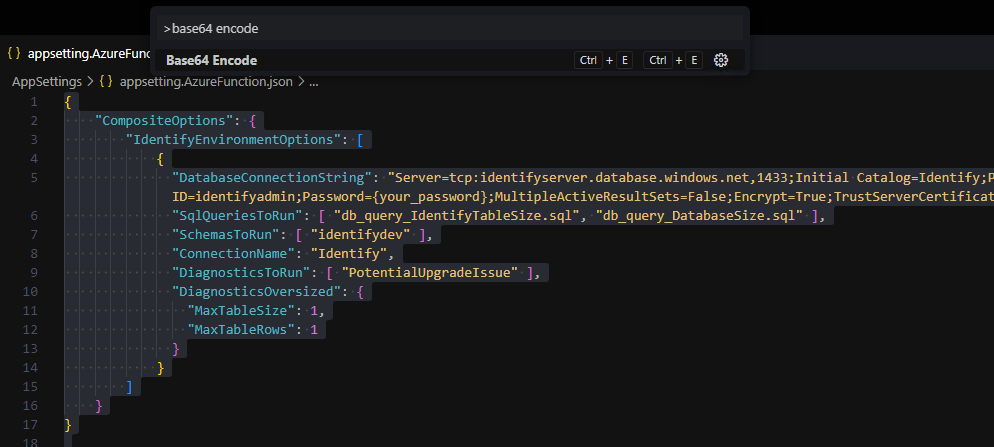 In this example, we used the VS Code extension
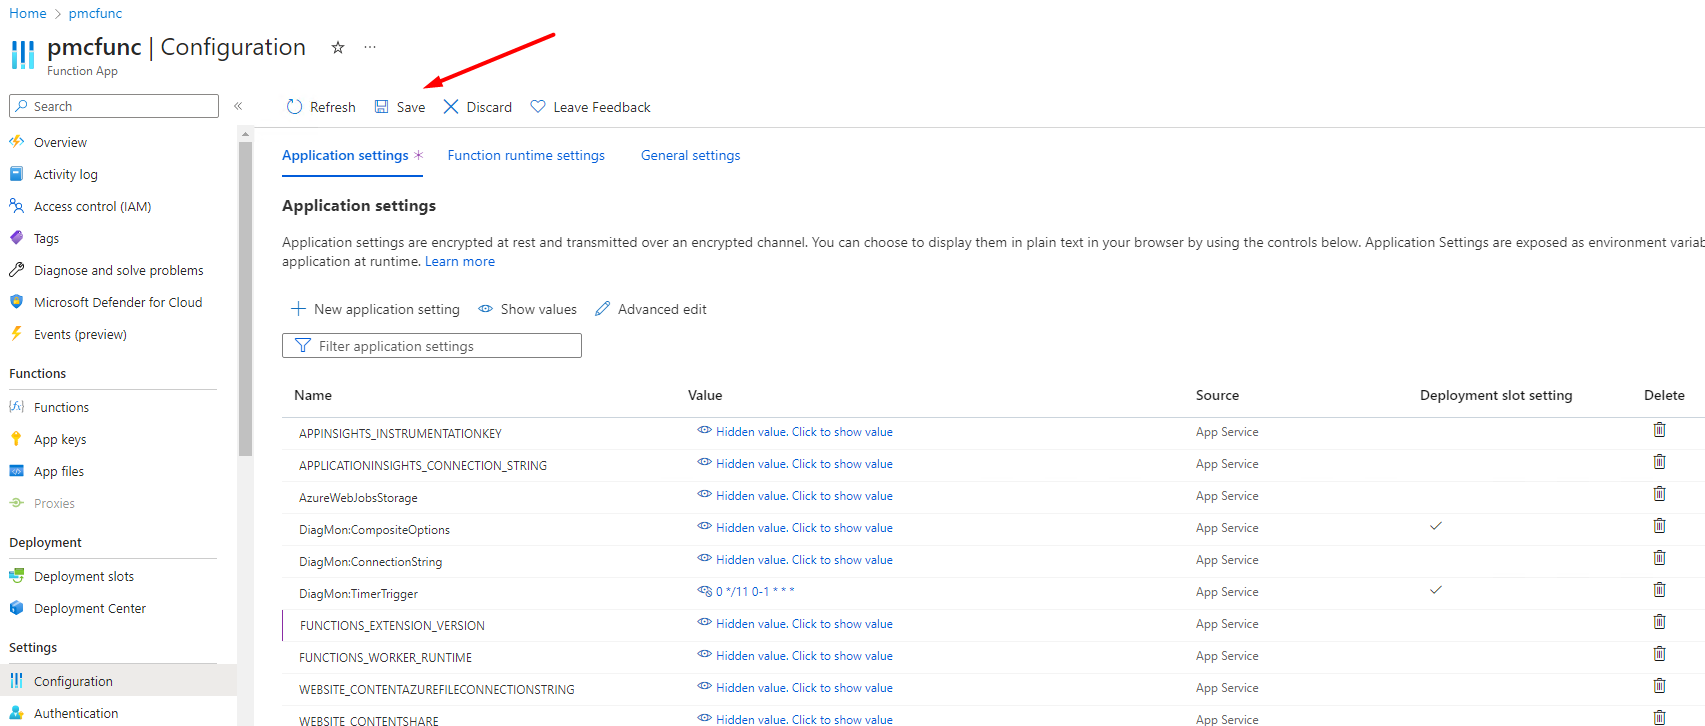
 vscode-base64.Step 3: Create a new application setting named
DiagMon:CompositeOptionsand paste the Base64-encoded value created in Step 2 into the value field. Then, click OK to save the setting.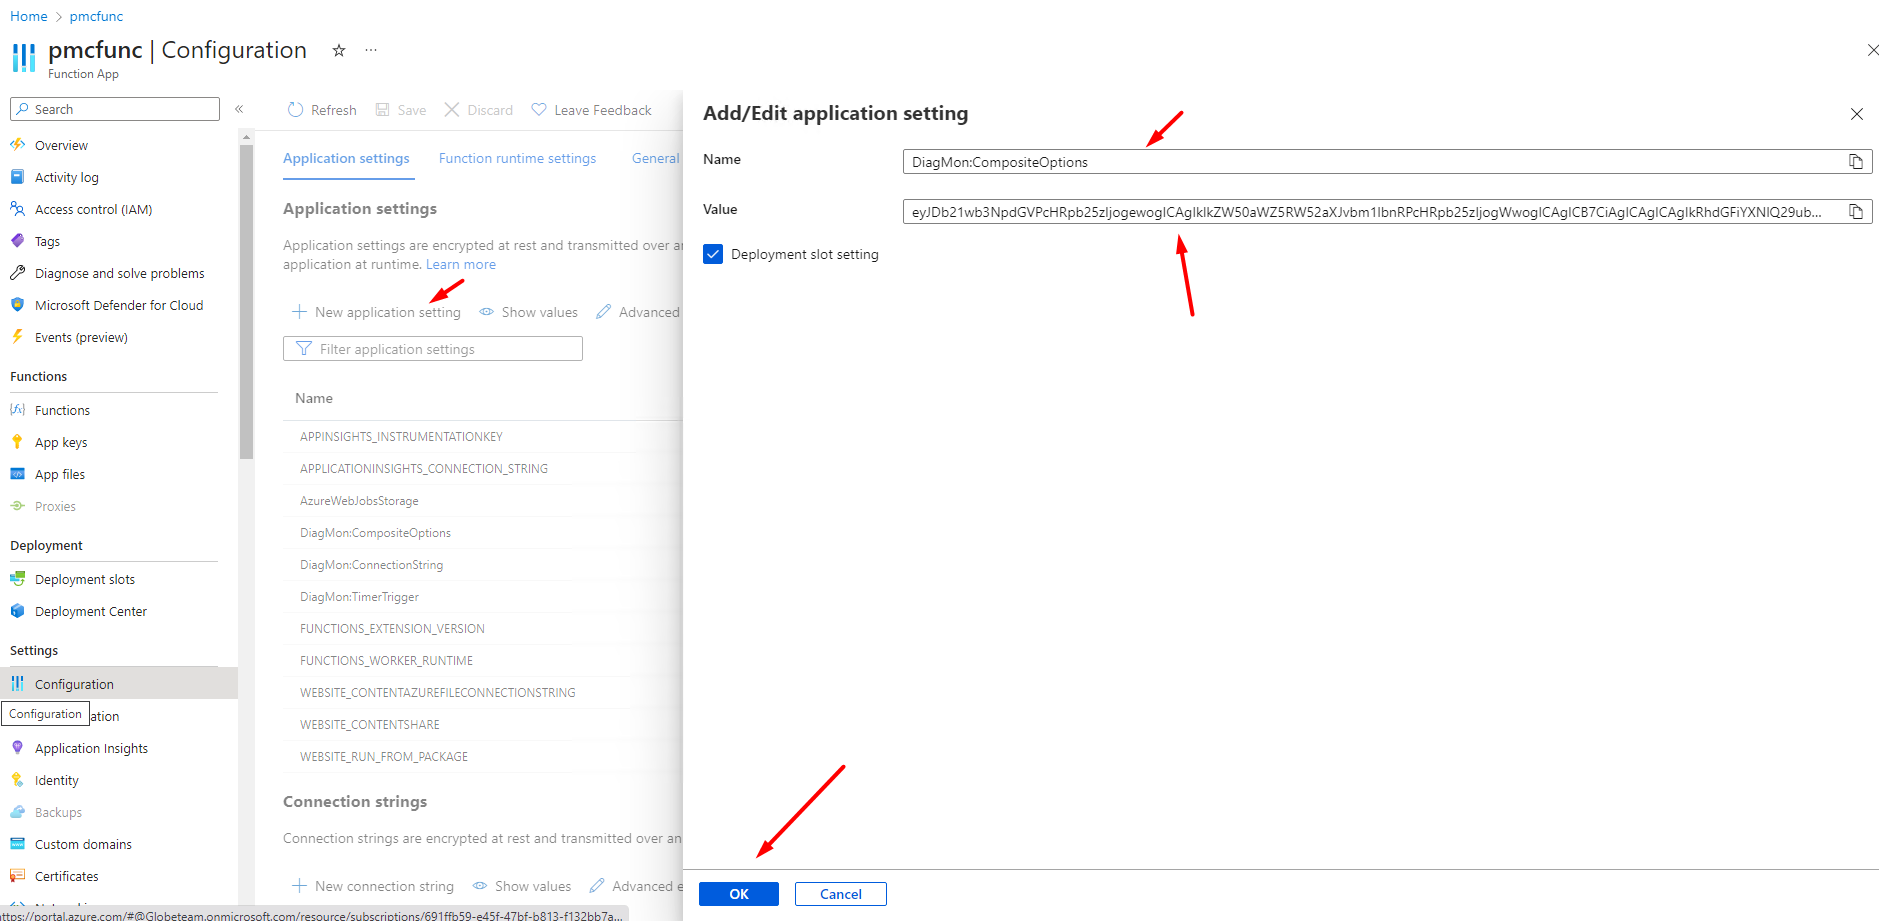
Steps 4 and 5 are optional, as the Azure Function includes default Application Insights settings when it is created. If you want to log to your own Application Insights instance, proceed with these steps.
Step 4: Update
APPLICATIONINSIGHTS_CONNECTION_STRINGsetting.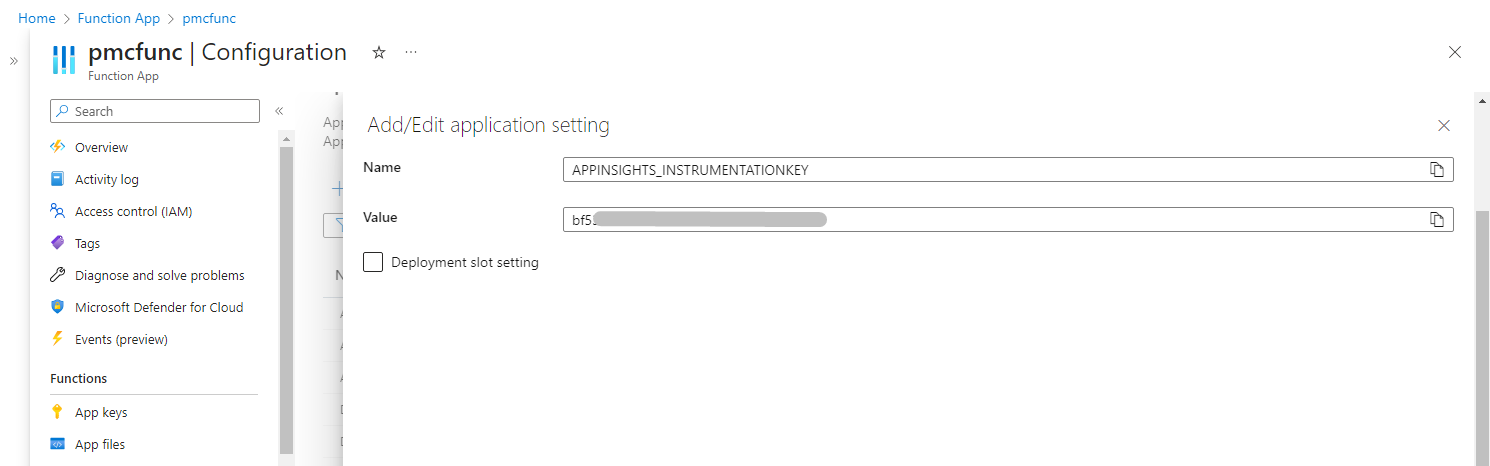
Step 5: Add
APPINSIGHTS_INSTRUMENTATIONKEYsetting.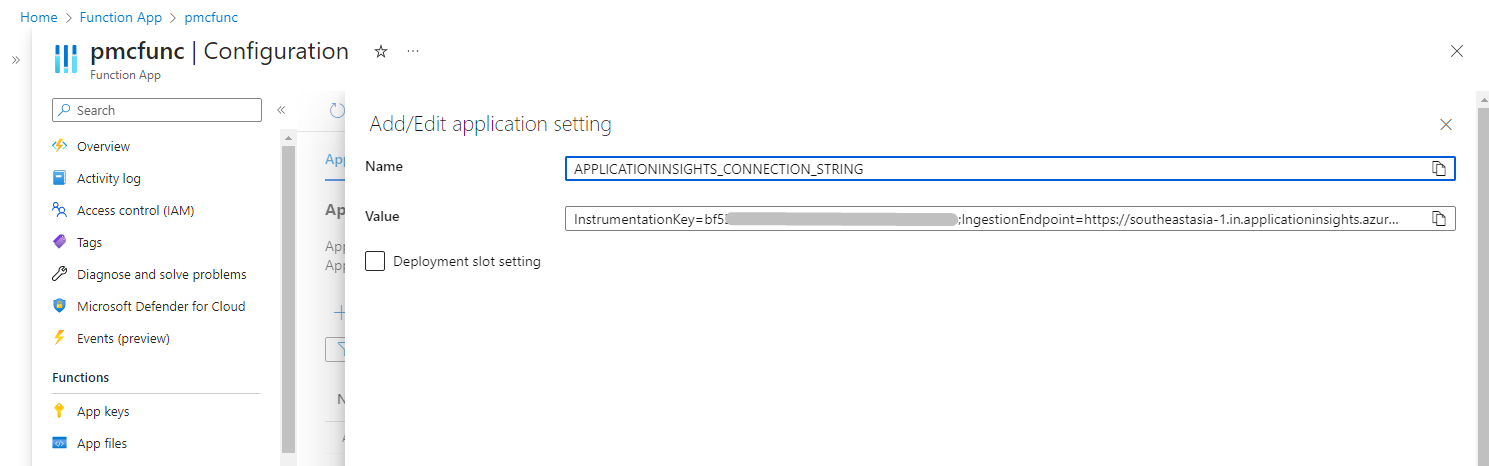
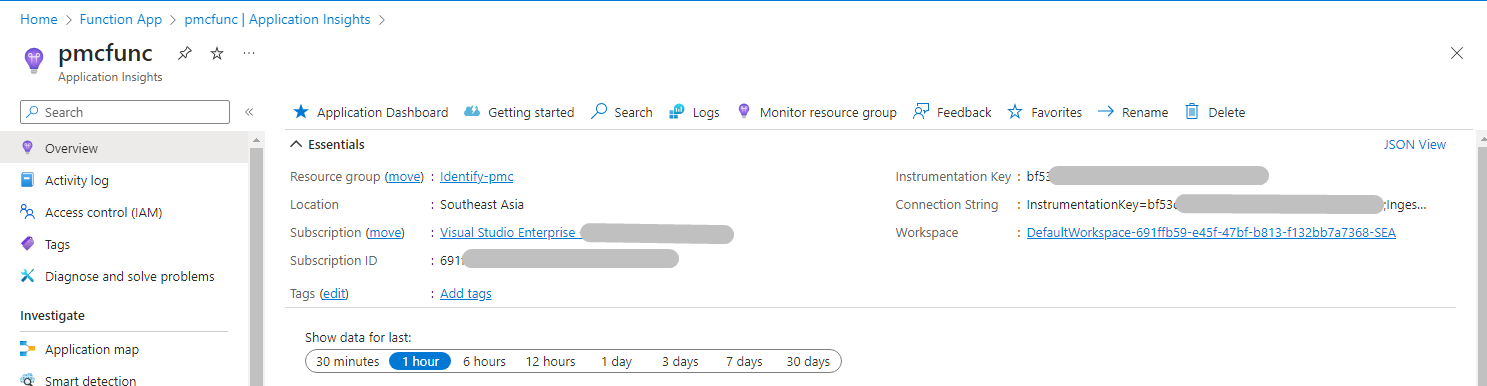
Note: Find your Instrumentation key and connection string in Application Insights overview.
Step 6: Click the Save button to save the configuration changes.
Note:
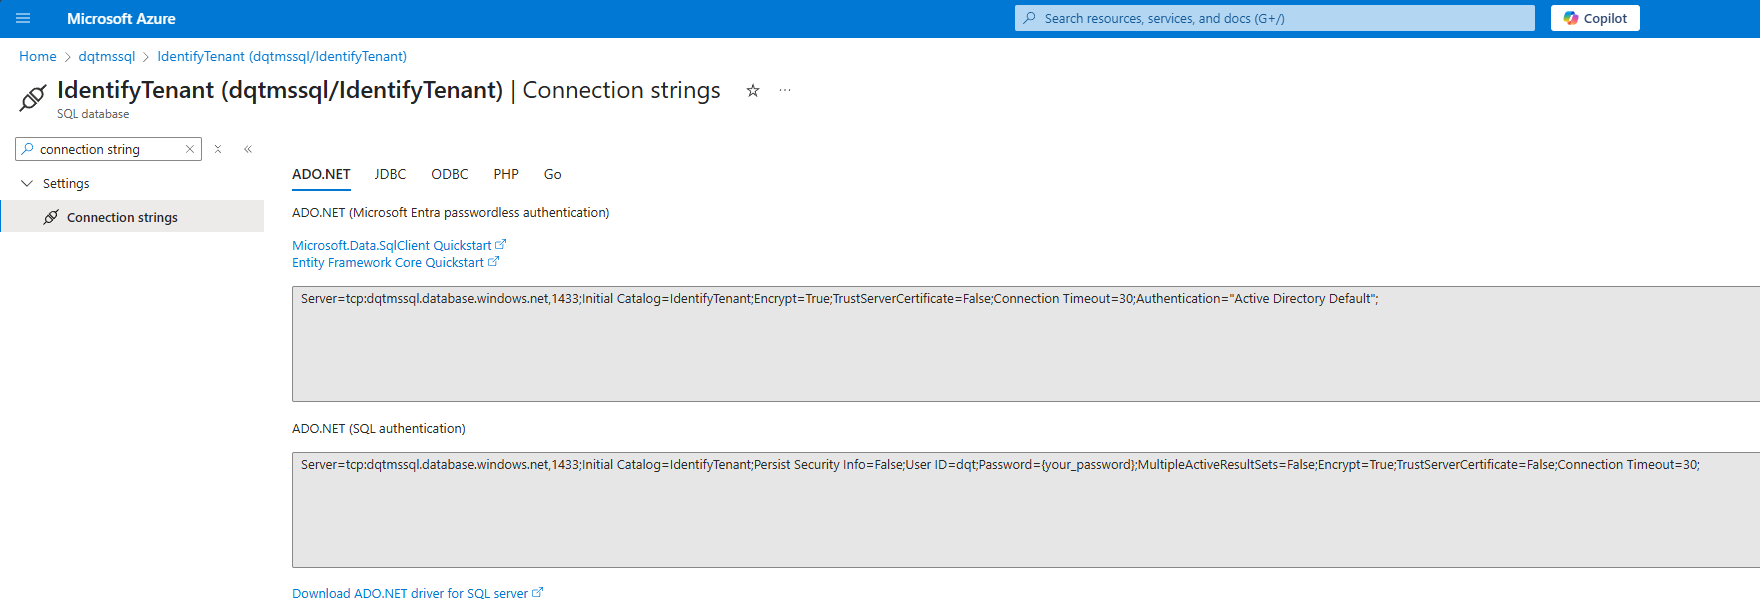
When configuring Azure Functions, using the Connection strings section in the Configuration menu is optional.
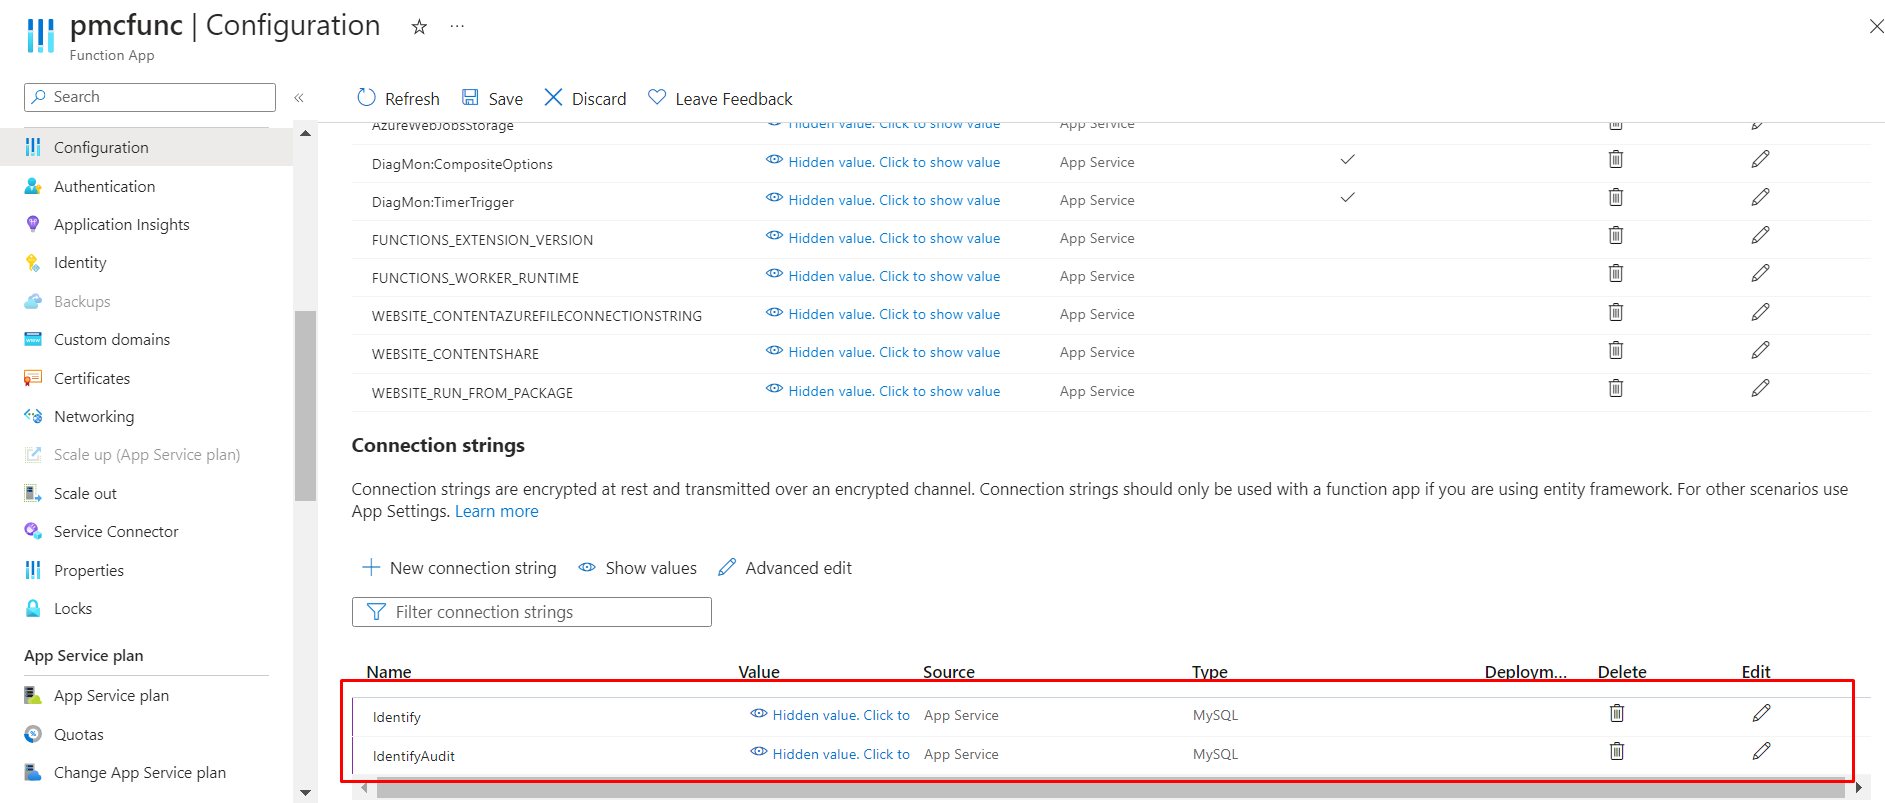
If a connection string is set in the Azure Functions configuration, and the ConnectionName in CompositeOptions matches the database name in the Azure Functions configuration connection string, then the DatabaseConnectionString in CompositeOptions will be set to the connection string from the Azure Functions configuration.
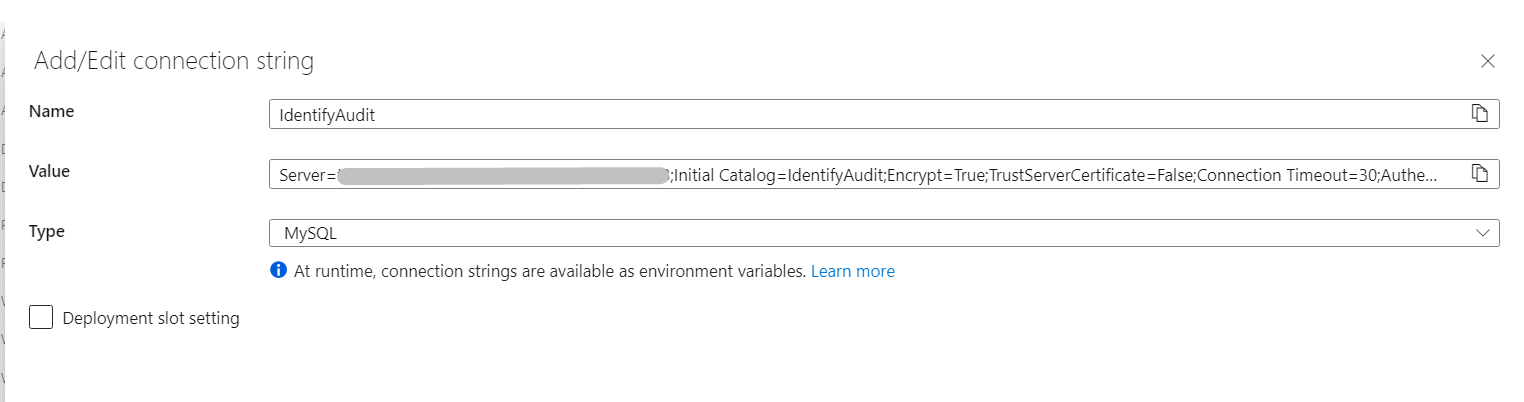
For example, suppose that you want to update the DatabaseConnectionString of IdentifyAudit as shown below:
  {
    "DatabaseConnectionString": "Server=localhost; Database=IdentifyAudit; uid=dev; pwd={your_password} ; MultipleActiveResultSets=true;MultiSubnetFailover=False;TrustServerCertificate=True;",
    "SqlQueriesToRun": [ "db_query_DatabaseSize.sql", "schema_query_IdentifyIndex.sql", "db_query_IdentifyTableSize.sql" ],
    "SchemasToRun": [ "identify01", "identify02" ],
    "ConnectionName": "IdentifyAudit",
    "DiagnosticsToRun": [ "DatabaseNonQuery", "DatabaseDiagnostics" ]
  }
You can add the connection string of IdentifyAudit, which will replace the DatabaseConnectionString in CompositeOptions.
Deploy Azure Functions package
Steps to deploy a package:
Navigate to download site, and select DiagMon to download the application.
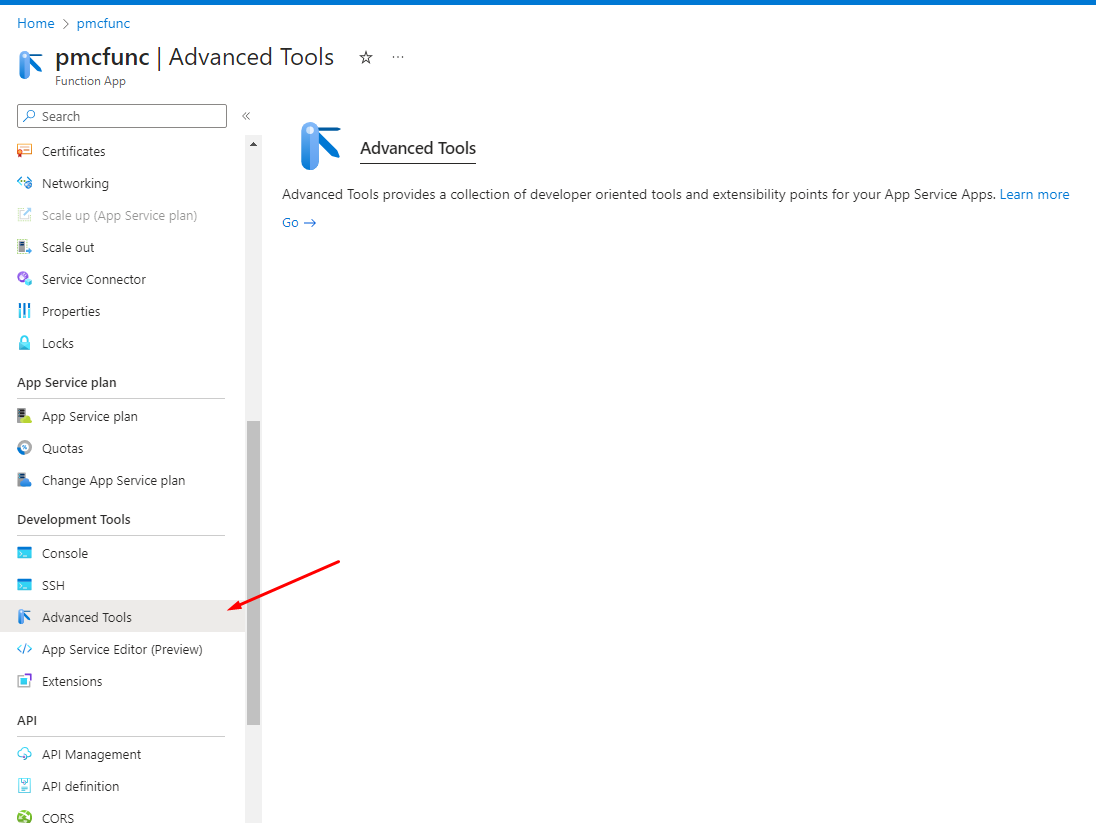
Navigate to Advanced Tools > Click Go (it will redirect to the Kudu Service).
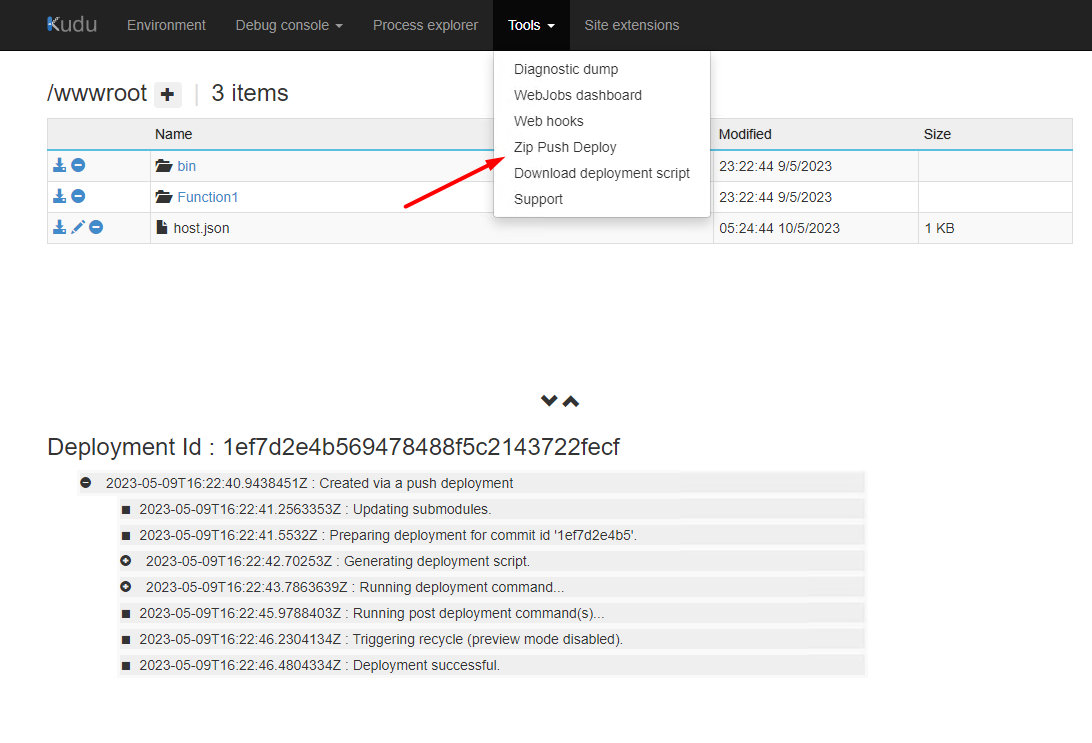
Then select Zip Push Deploy on Tools
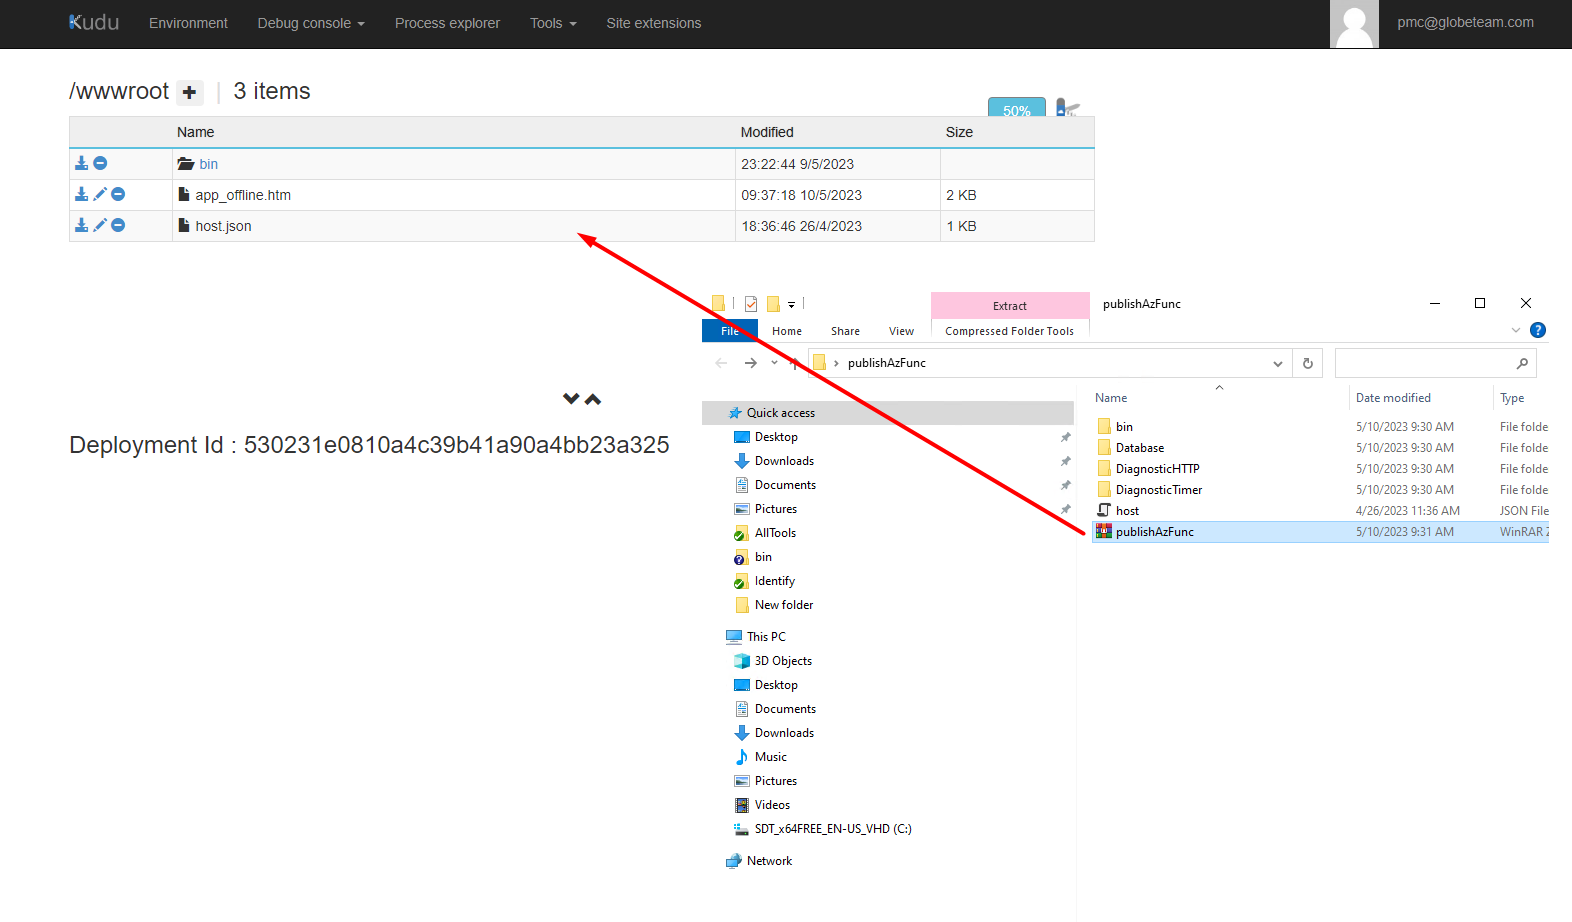
Zip the DiagMon-Azure folder that you downloaded earlier, then drag the zip file into the wwwroot directory and wait for deployment to succeed.
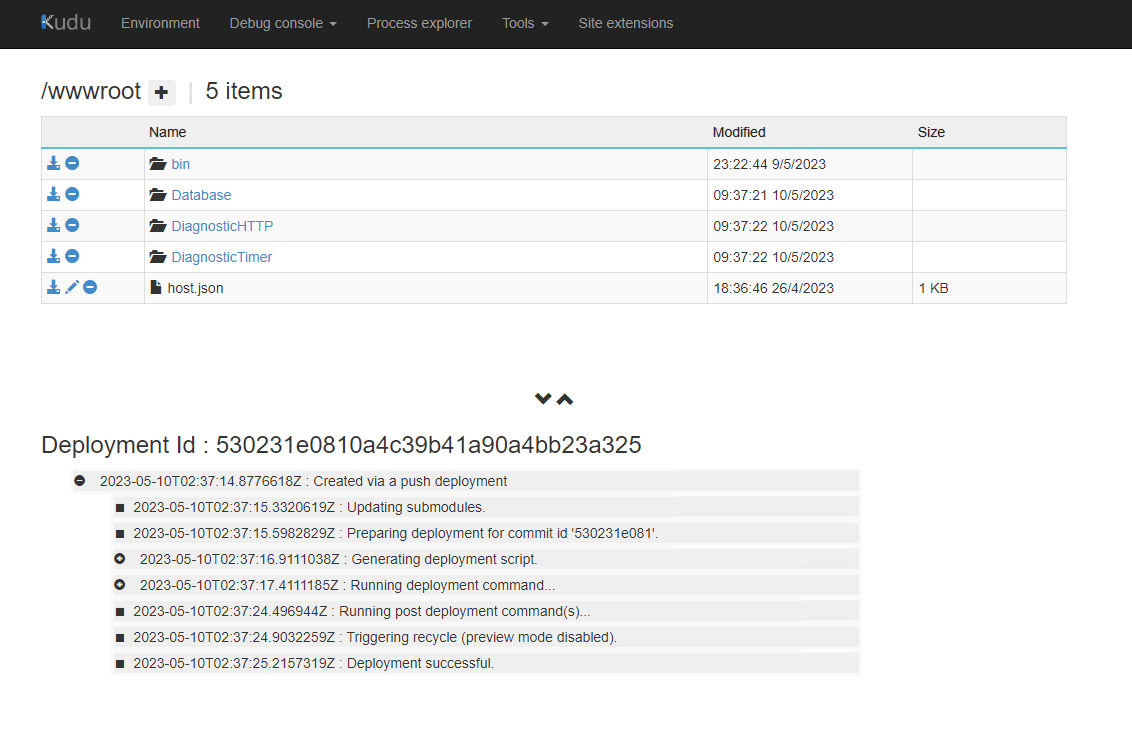
The sample result after successful deployment:
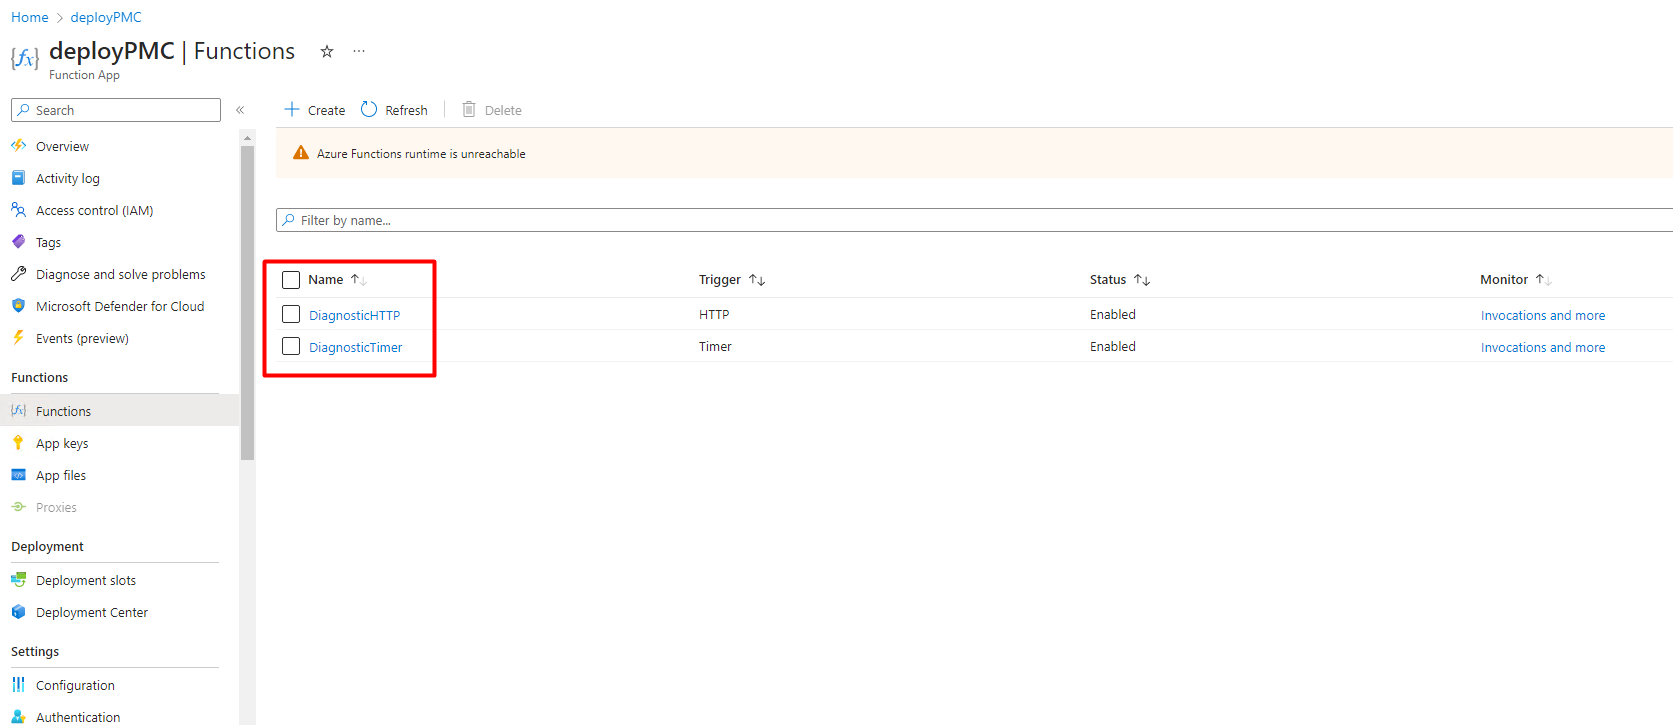
Back to your Function App > Functions, the deployed function should appear.
Use managed identity to access the database
Follow the instructions in Tutorial: Use a Windows VM system-assigned managed identity to access Azure SQL, but replace VM with Azure Function.
Steps:
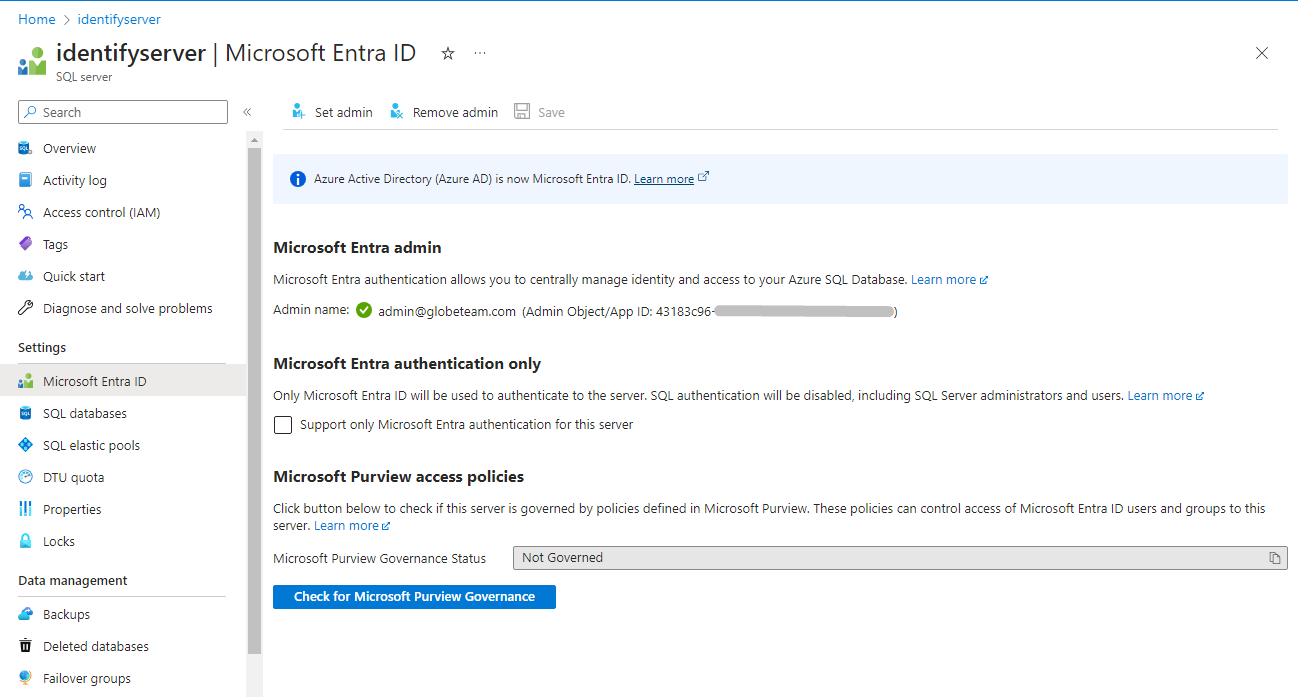
- Enable Microsoft Entra Authentication to the SQL Database
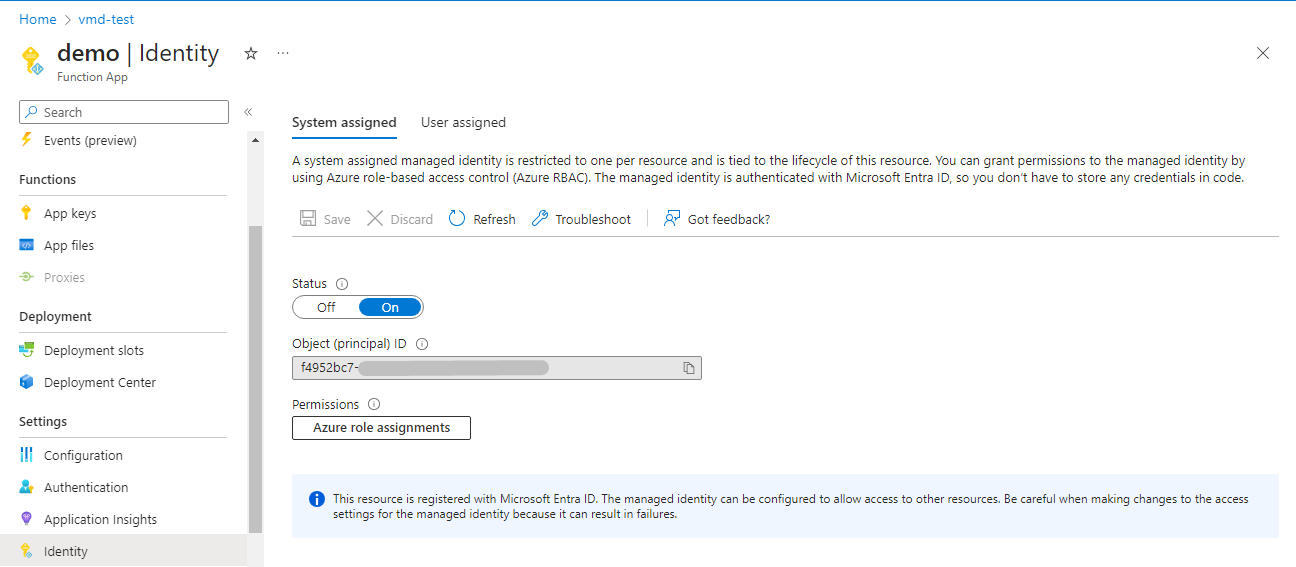
- Enable Azure Function managed identity
- Grant SQL Database Access to the Managed Identity
CREATE USER [<identity-name>] FROM EXTERNAL PROVIDER;
ALTER ROLE db_datareader ADD MEMBER [<identity-name>];
ALTER ROLE db_datawriter ADD MEMBER [<identity-name>];
GRANT VIEW DATABASE STATE TO [<identity-name>];
GO

/*
<identity-name> is the name of the managed identity in Microsoft Entra ID. If the identity
is system-assigned, the name is always the same as the name of your Function app.

- db_datareader role: a fixed-database role that grants the user the permission to read all data from all user tables in the database.
- db_datawriter role: a fixed-database role that grants the user permission to add, delete, or change data in all user tables in the database.
- VIEW DATABASE STATE permission: allows the user to view current state information of the database, such as the number of connections and transactions.
*/
Set up allowlist IPs
Access to Azure SQL databases is usually limited to specific client IP addresses. Meanwhile, Azure Functions using a free plan can have different IPs each time they execute. You can use Function app inbound IP address to get the possible outbound IP list, but configuring all of them in firewall rules can be cumbersome.
Execute on Azure Functions
Azure Functions will be triggered based on its configuration.
Manually trigger
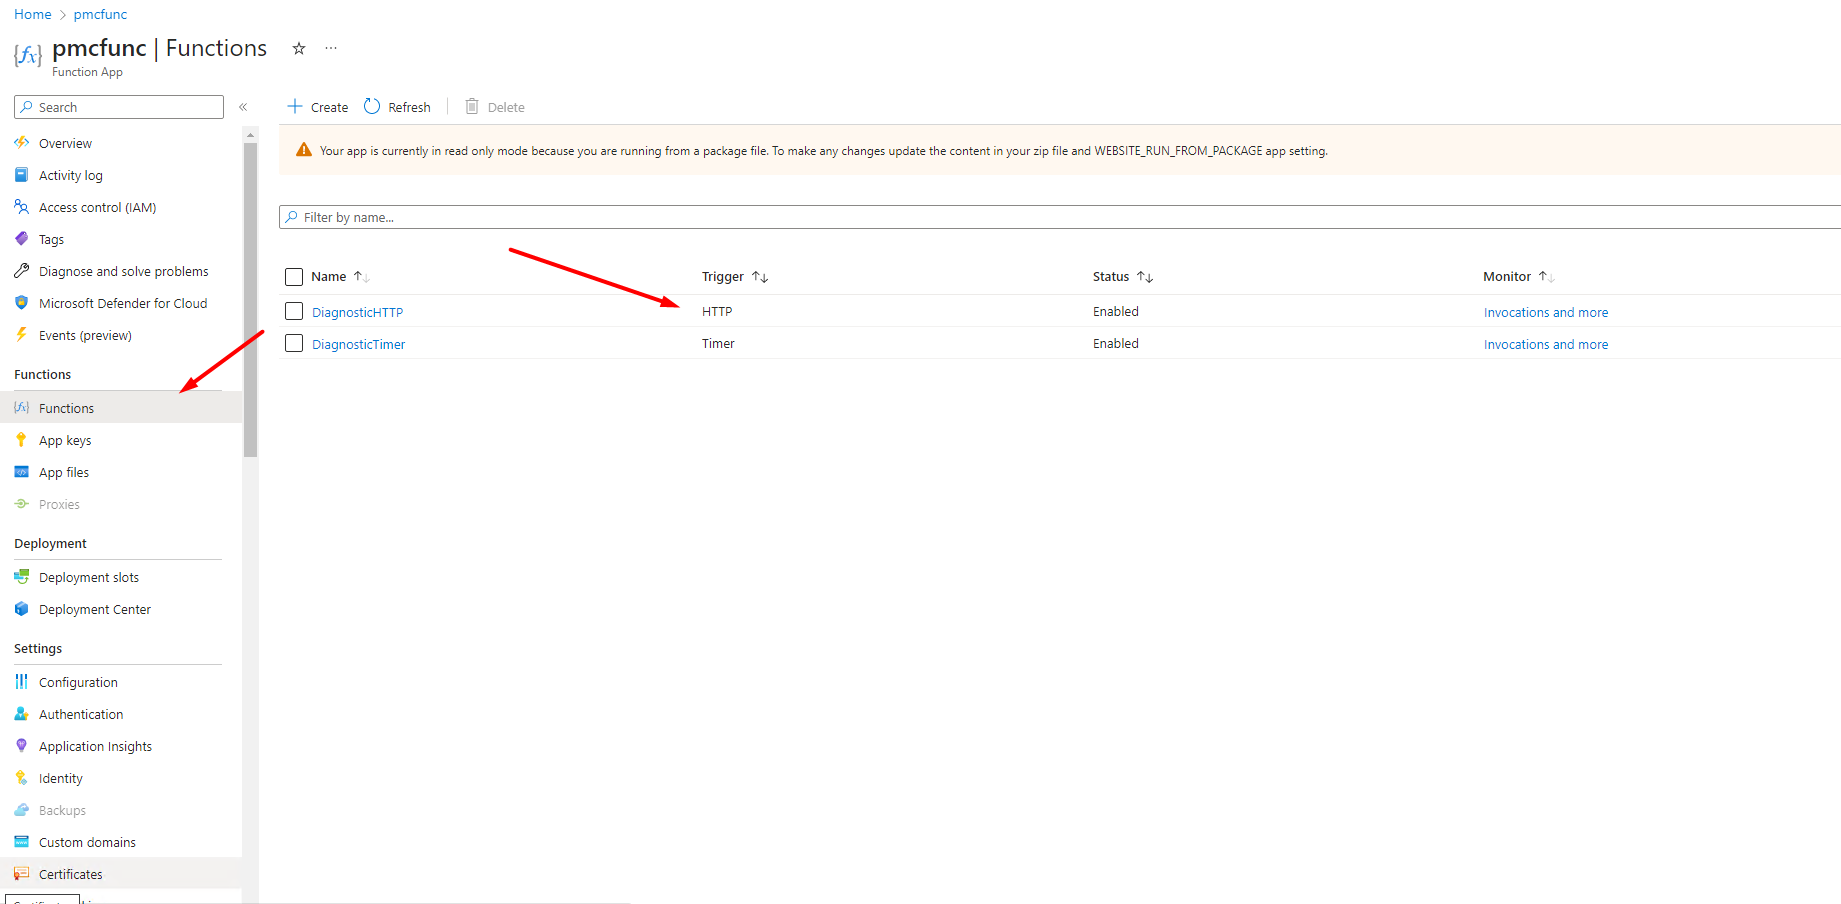
Navigate to Function App in Azure Portal > Functions
Select the function with trigger type HTTP.
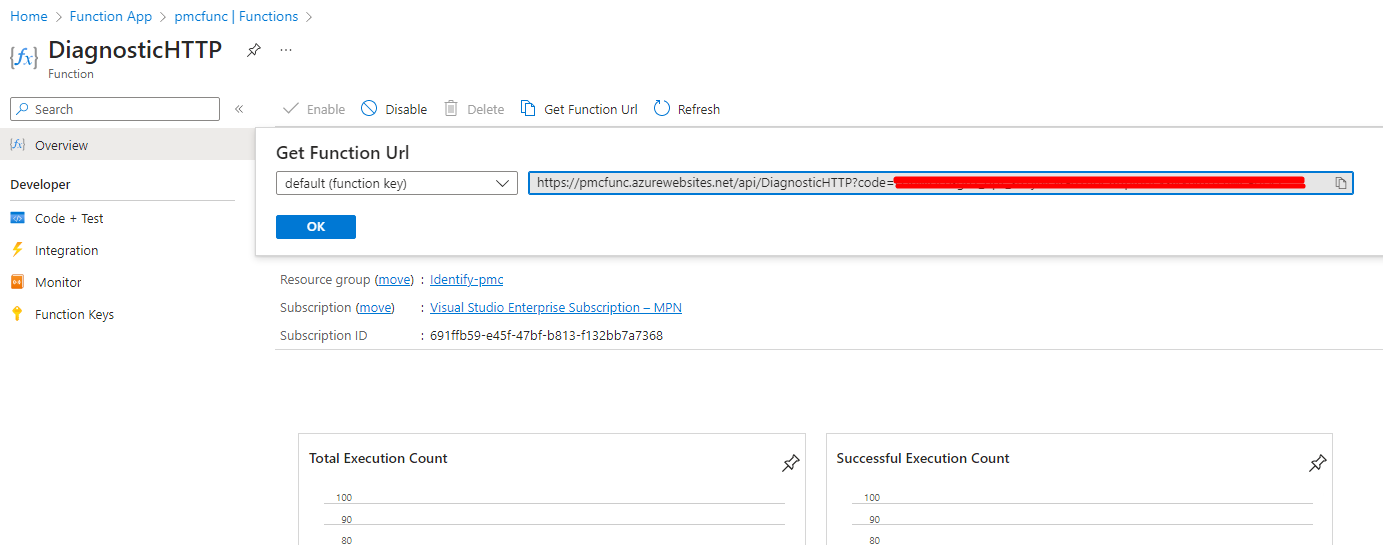
In the Overview tab of your Azure Functions app, click Get Function URL to obtain the trigger URL. Copy this URL and paste it into a browser to trigger diagnostics with an HTTP GET request.
To view the diagnostic results, navigate to the Application Insights instance that was configured in your settings.
Function app timeout duration
The functionTimeout property in the host.json file determines how long a function can run before it is canceled. HTTP triggered functions have a limit of 230 seconds regardless of the setting. The following table shows the default and maximum values (in minutes) for specific plans:
| Plan | Default | Maximum |
|---|---|---|
| Consumption plan | 5 | 10 |
| Premium plan | 30 | Unlimited* |
| Dedicated plan | 30 | Unlimited* |
*Up to 60 minutes. OS and runtime updates can still cancel functions.
CompositeOptions configuration using the HTTP request body
To customize the configuration of CompositeOptions in an Azure Function using an HTTP request, you should create a JSON request body containing the desired settings for CompositeOptions. When the HTTP trigger executes, it will read the settings from the request body and override any settings in the Azure Configuration object.
Example:
{
  "CompositeOptions": {
    "IdentifyEnvironmentOptions": [
      {
        "DatabaseConnectionString": "Identify",
        "SqlQueriesToRun": [ "db_query_DatabaseSize.sql"],
        "SchemasToRun": [ "identify01" ],
        "ConnectionName": "Identify",
        "DiagnosticsToRun": [ "DatabaseNonQuery", "DatabaseDiagnostics" ]
      },
    ]
  }
}
// Azure configuration CompositeOptions after Base64Decrypt
{
  "CompositeOptions": {
    "IdentifyEnvironmentOptions": [
      {
        "DatabaseConnectionString": "Identify",
        "SqlQueriesToRun": [ "db_query_IdentifyIndex.sql"],
        "SchemasToRun": [ "identify02"],
        "ConnectionName": "Identify",
        "DiagnosticsToRun": [ "DatabaseNonQuery", "DatabaseDiagnostics" ]
      },
    ]
  }
}
// Request body: Custom SchemasToRun, SqlQueriesToRun
{
  "CompositeOptions": {
    "IdentifyEnvironmentOptions": [
      {
        "DatabaseConnectionString": "Identify",
        "SqlQueriesToRun": [ "db_query_IdentifyIndex.sql"],
        "SchemasToRun": [ "identify02"],
        "ConnectionName": "Identify",
        "DiagnosticsToRun": [ "DatabaseNonQuery", "DatabaseDiagnostics" ]
      },
    ]
  }
}
// Result
Note:
The parameters for customization include: DiagnosticsToRun, SqlQueriesToRun, SchemasToRun, SqlCommandsToRun, Schema, ExecutionPath. When customizing a specific CompositeOptions Azure Function, it's essential to include the ConnectionName parameter in the request body. This parameter is utilized to map the request to the corresponding ConnectionName in the CompositeOptions Azure Function.
In the case of IdentifyInstanceOptions, the presence of the Schema in the request body for your CompositeOptions Azure Functions will either override SqlCommandsToRun or add this schema configuration to the CompositeOptions Azure Functions. To clarify, if the IdentifyInstanceOptions object in the request body contains a value for the Schema property, it will override the SqlCommandsToRun property in the CompositeOptions Azure Function linked to the ConnectionName specified in the request body. However, if the Schema property is absent in the request body, the IdentifyInstanceOptions object will add a configuration for the corresponding CompositeOptions Azure Function.
Example: Azure configuration CompositeOptions after Base64Decrypt
{
    "CompositeOptions": {
        "IdentifyEnvironmentOptions": [
            {
                "DatabaseConnectionString": "Identify",
                "ConnectionName": "Identify",
                "IdentifyInstanceOptions": [
                    {
                        "Schema": "dev",
                        "SqlCommandsToRun": [
                            {
                                "Command": "a.sql"
                            }
                        ]
                    },
                ],
            },
        ]
    }
}
Request body: Custom SchemasToRun, SqlQueriesToRun
{
    "CompositeOptions": {
        "IdentifyEnvironmentOptions": [
            {
                "DatabaseConnectionString": "Identify",
                "ConnectionName": "Identify",
                "IdentifyInstanceOptions": [
                    {
                        "Schema": "dev",
                        "SqlCommandsToRun": [
                            {
                                "Command": "b.sql"
                            }
                        ]
                    },
                    {
                        "Schema": "monitor",
                        "SqlCommandsToRun": [
                            {
                                "Command": "x.sql"
                            }
                        ]
                    }
                ],
            },
        ]
    }
}
{ "CompositeOptions": { "IdentifyEnvironmentOptions": [ { "DatabaseConnectionString": "Identify", "ConnectionName": "Identify", "IdentifyInstanceOptions": [ { "Schema": "dev", "SqlCommandsToRun": [ { "Command": "b.sql" } ] }, { "Schema": "monitor", "SqlCommandsToRun": [ { "Command": "x.sql" } ] } ], }, ] } }
Use Function App directly
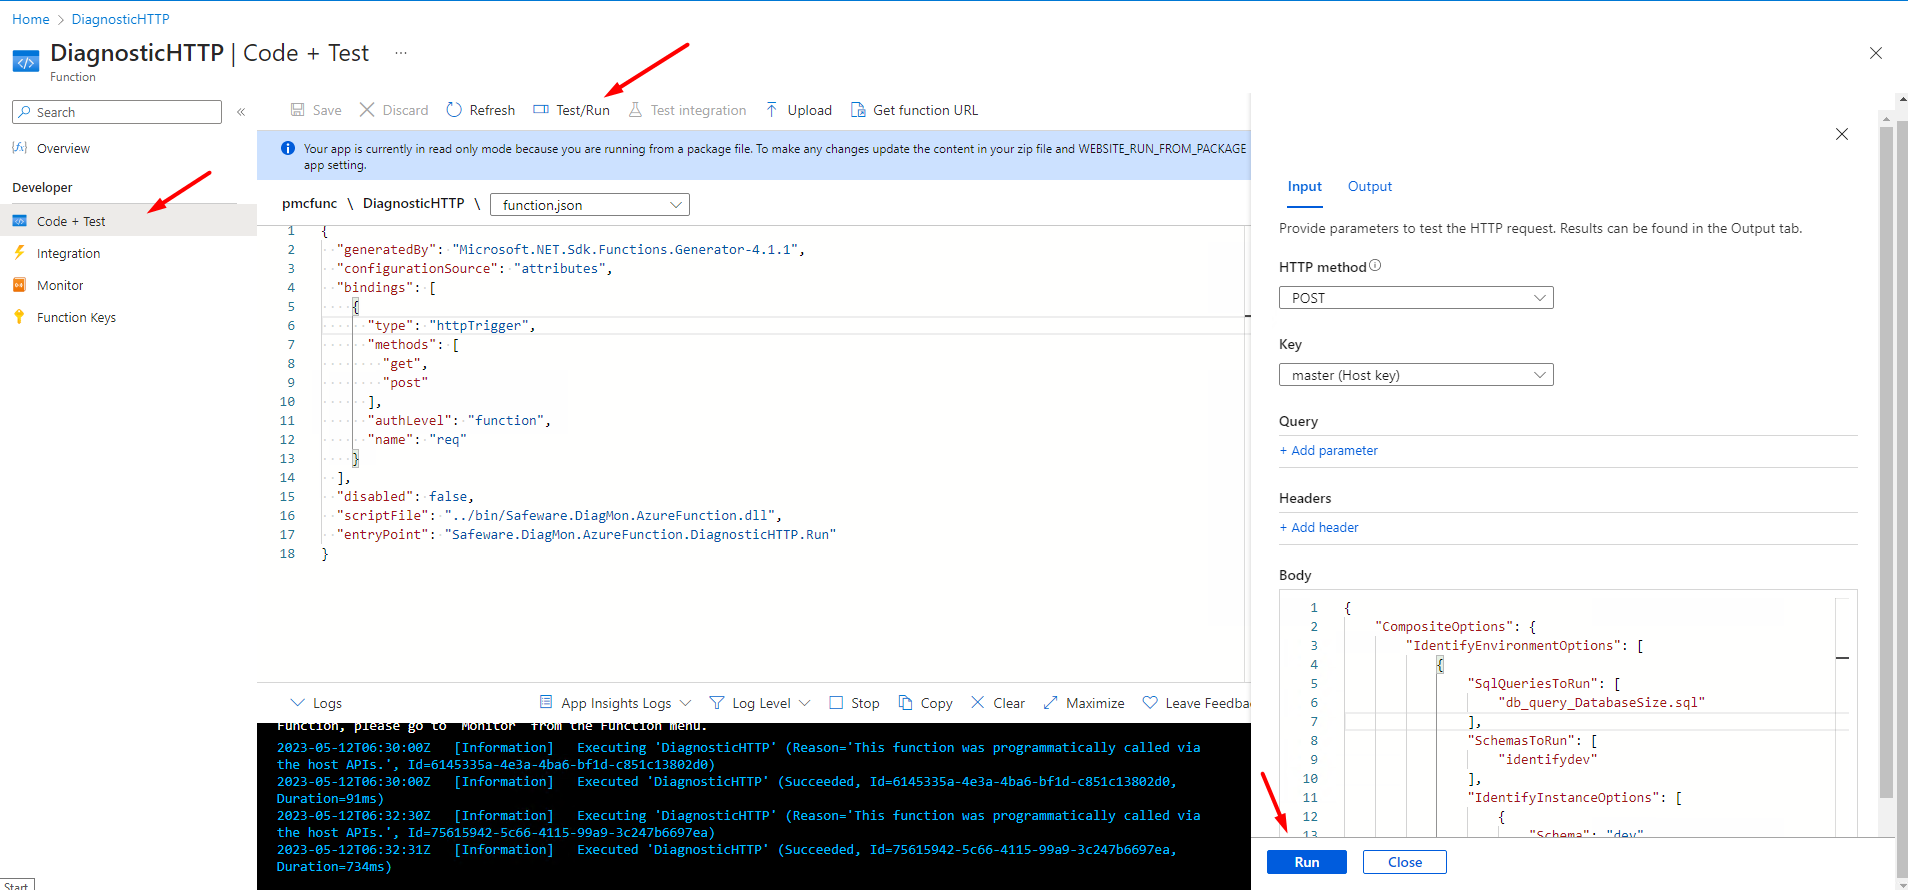
Navigate to your HTTP Function > Code + Test > Test/Run > Enter your Request body you want to customize CompositeOptions > Click Ok
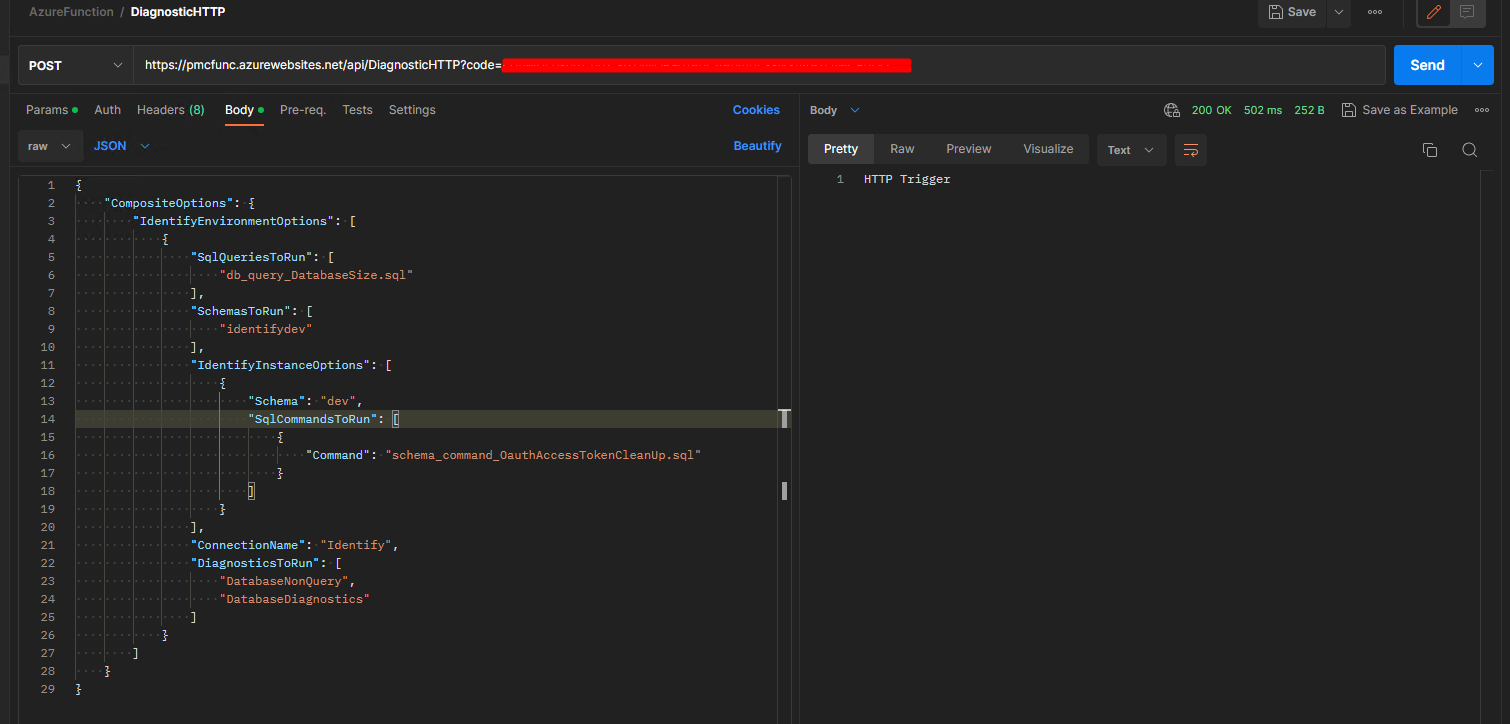
Use Postman
Navigate to your HTTP Function and Get Function URL
Try HTTP POST and enter your request body into Body area
Auto trigger
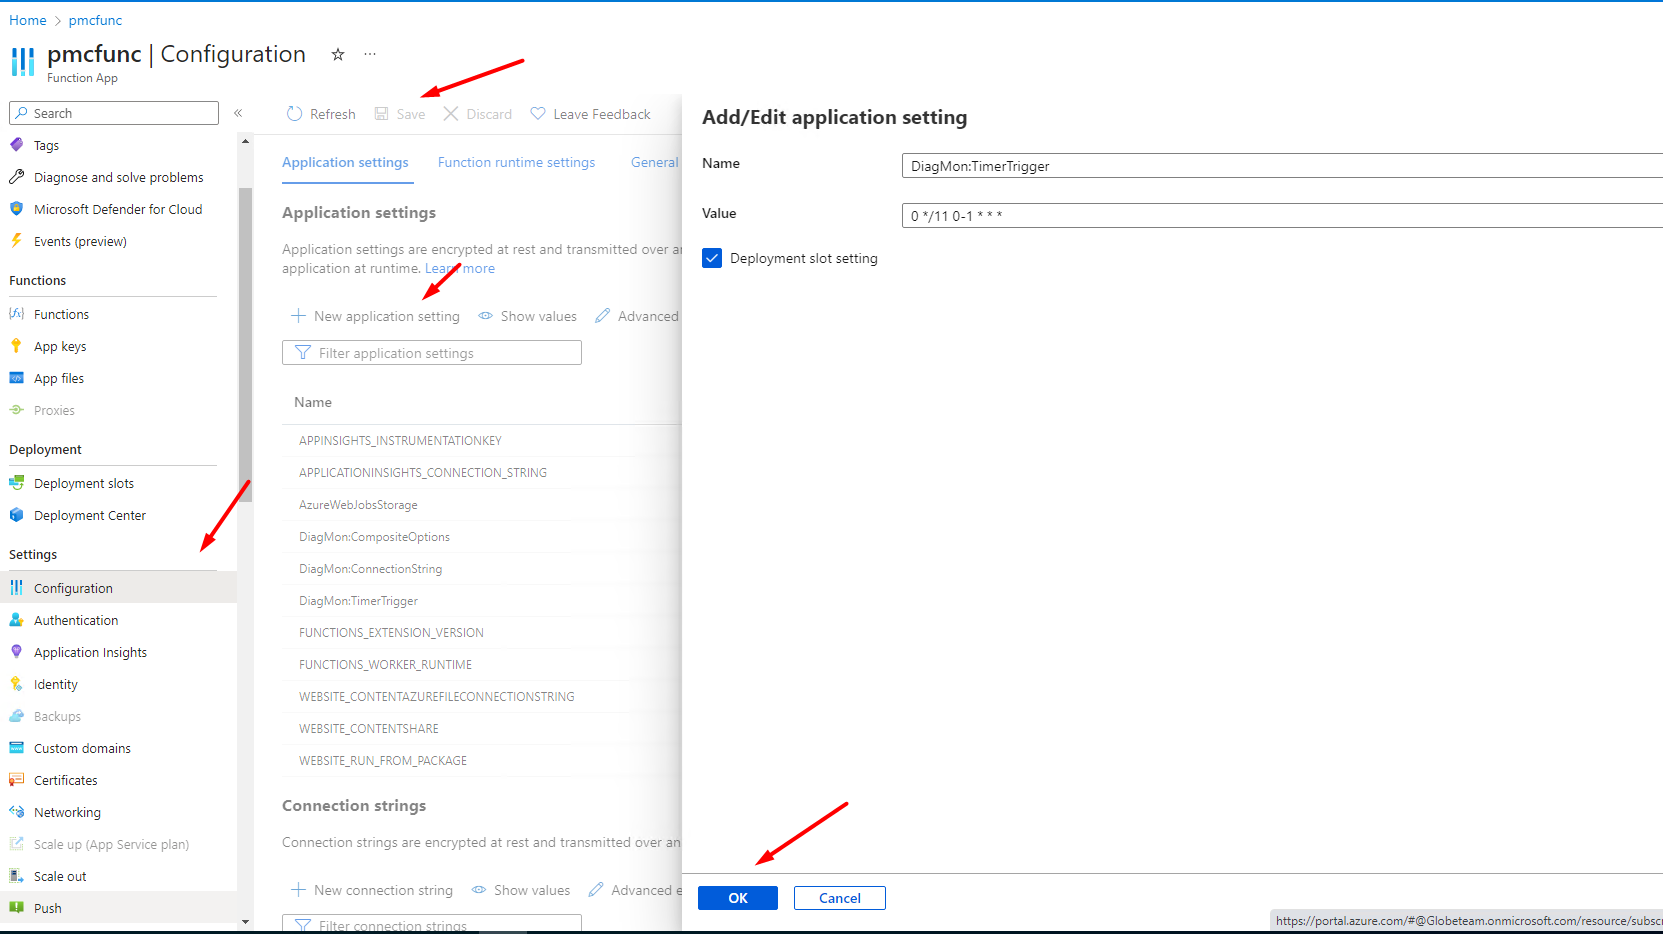
Azure Functions can automatically trigger diagnostics on a schedule. To customize the timer schedule for automatic diagnostics, navigate to the Configuration page and create a new application setting named DiagMon:TimerTrigger.
The setting uses cron format. For example, if you set it to 0 */11 0-1 * * *, the schedule runs every 11 minutes between 00:00 and 01:59 each day.
Troubleshooting
The steps below show how to troubleshoot errors, exceptions, and other performance issues by using insights from Application Insights failure logs:
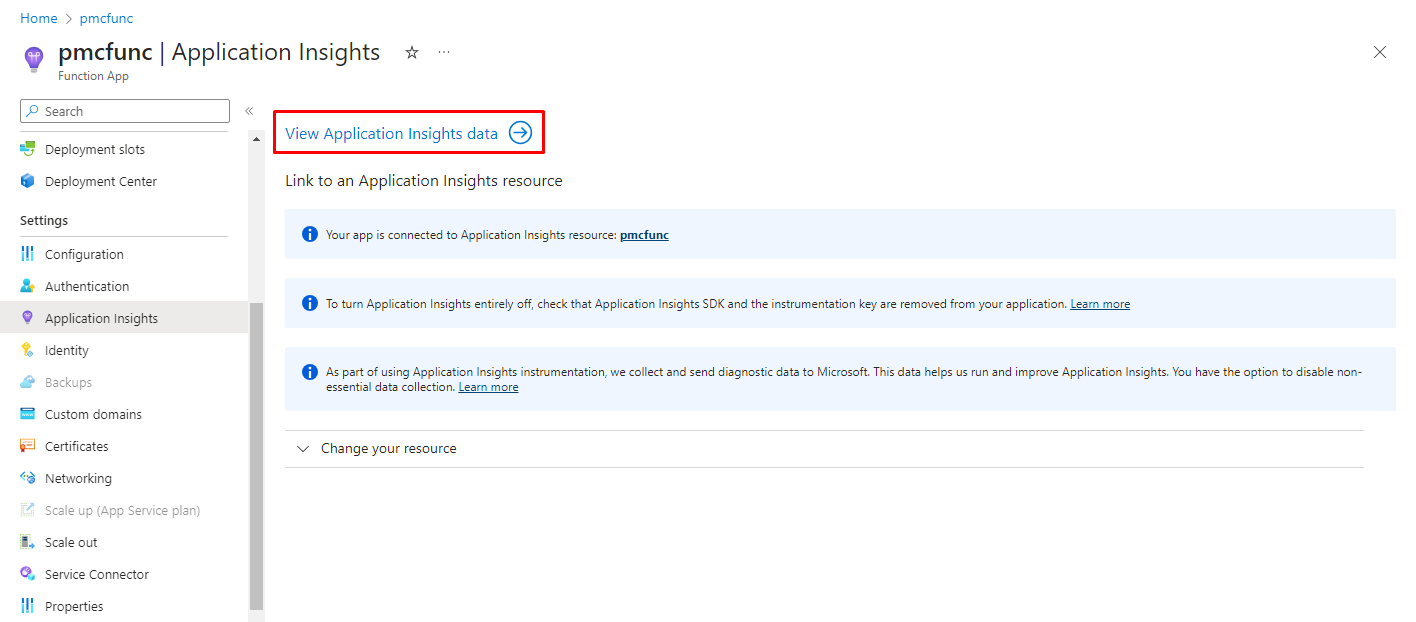
Open Application Insights:
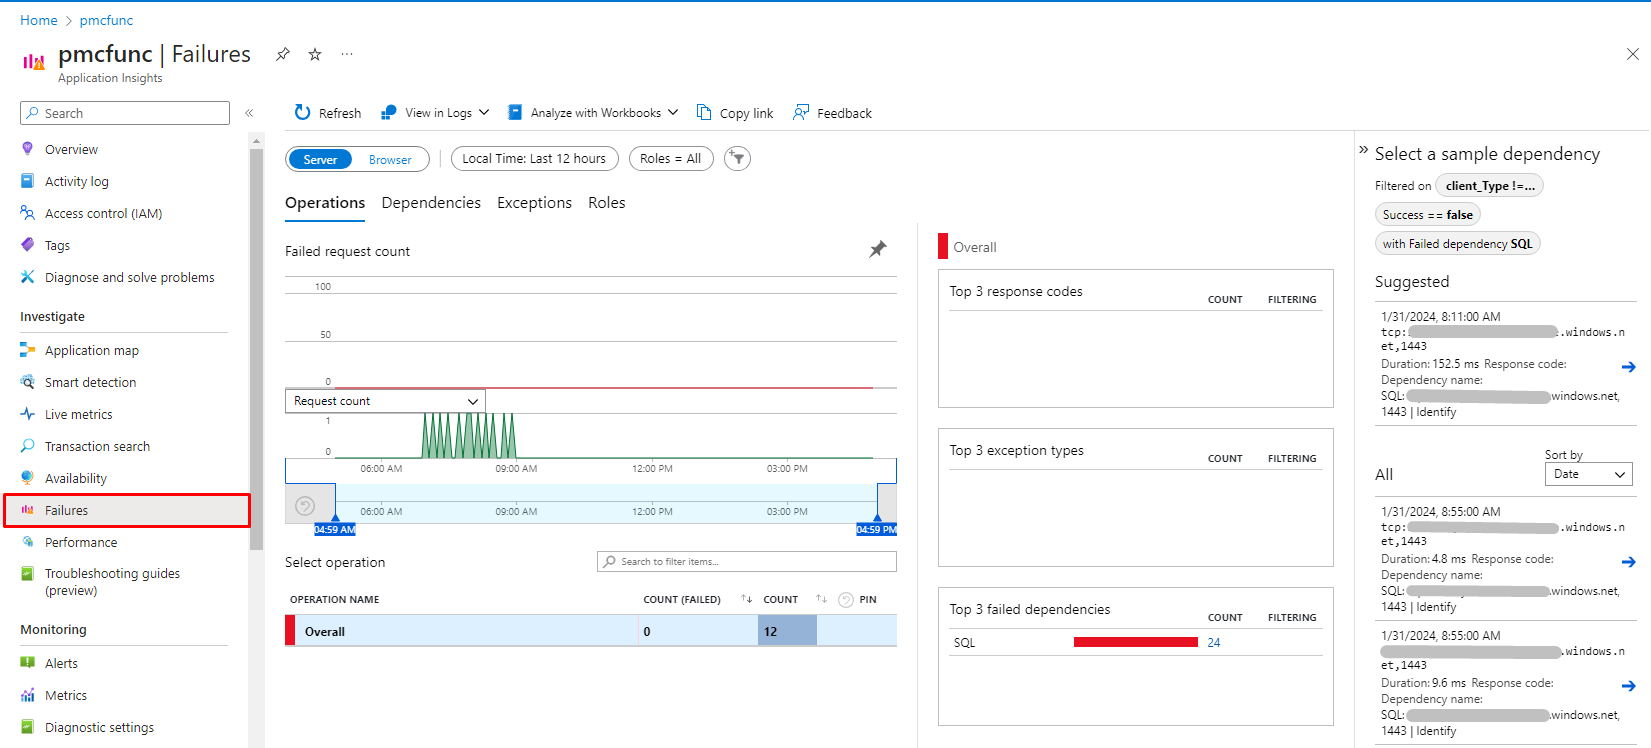
Access the Failures menu:
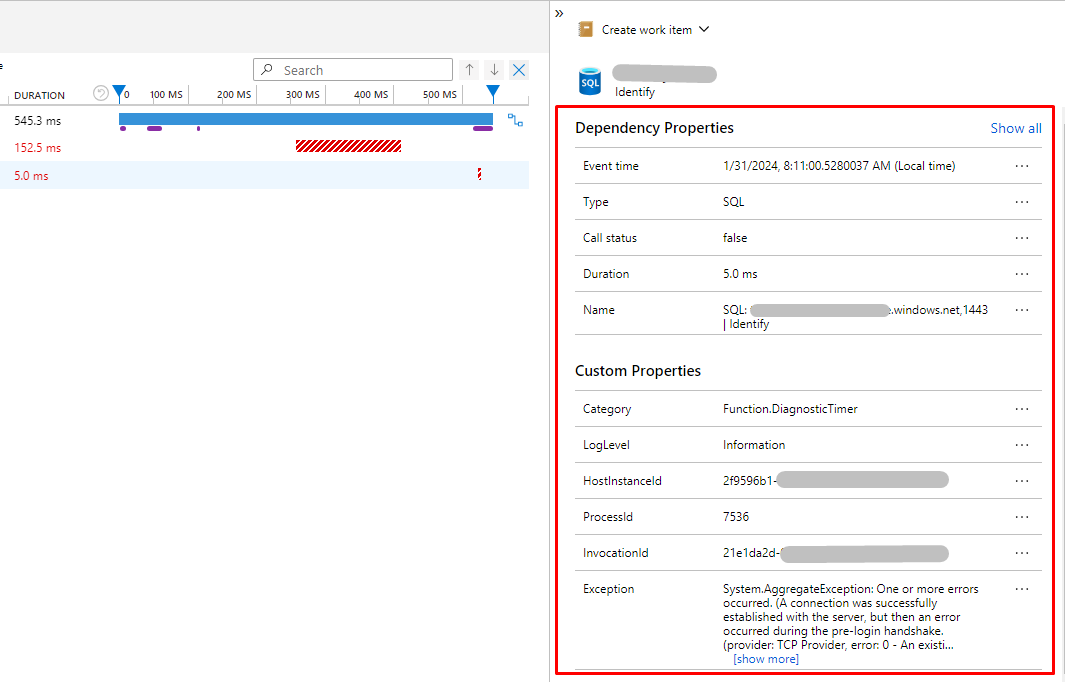
Review error details:
How to interpret diagnostics and monitoring results
The Diagnostics and Monitoring tool produces results in three modes: Console, File, and Application Insights. Note that for Azure Functions, results are written exclusively to Application Insights.
Console
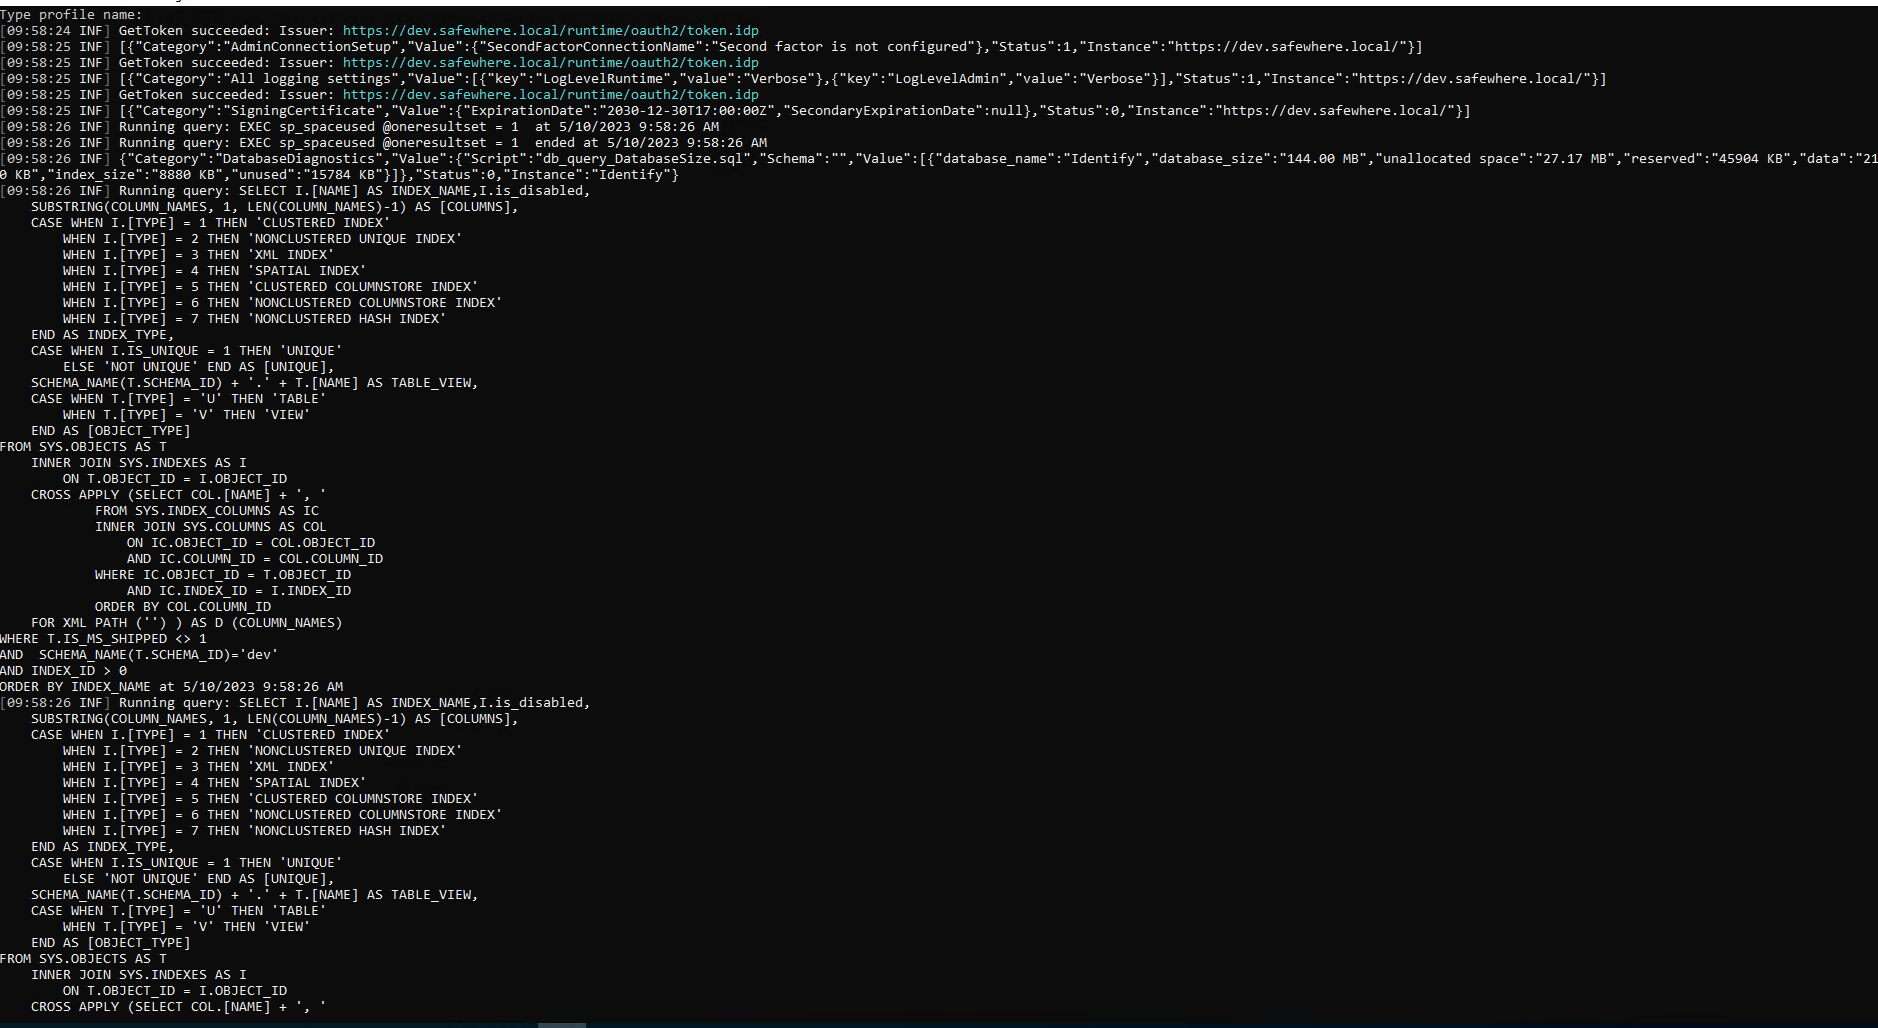
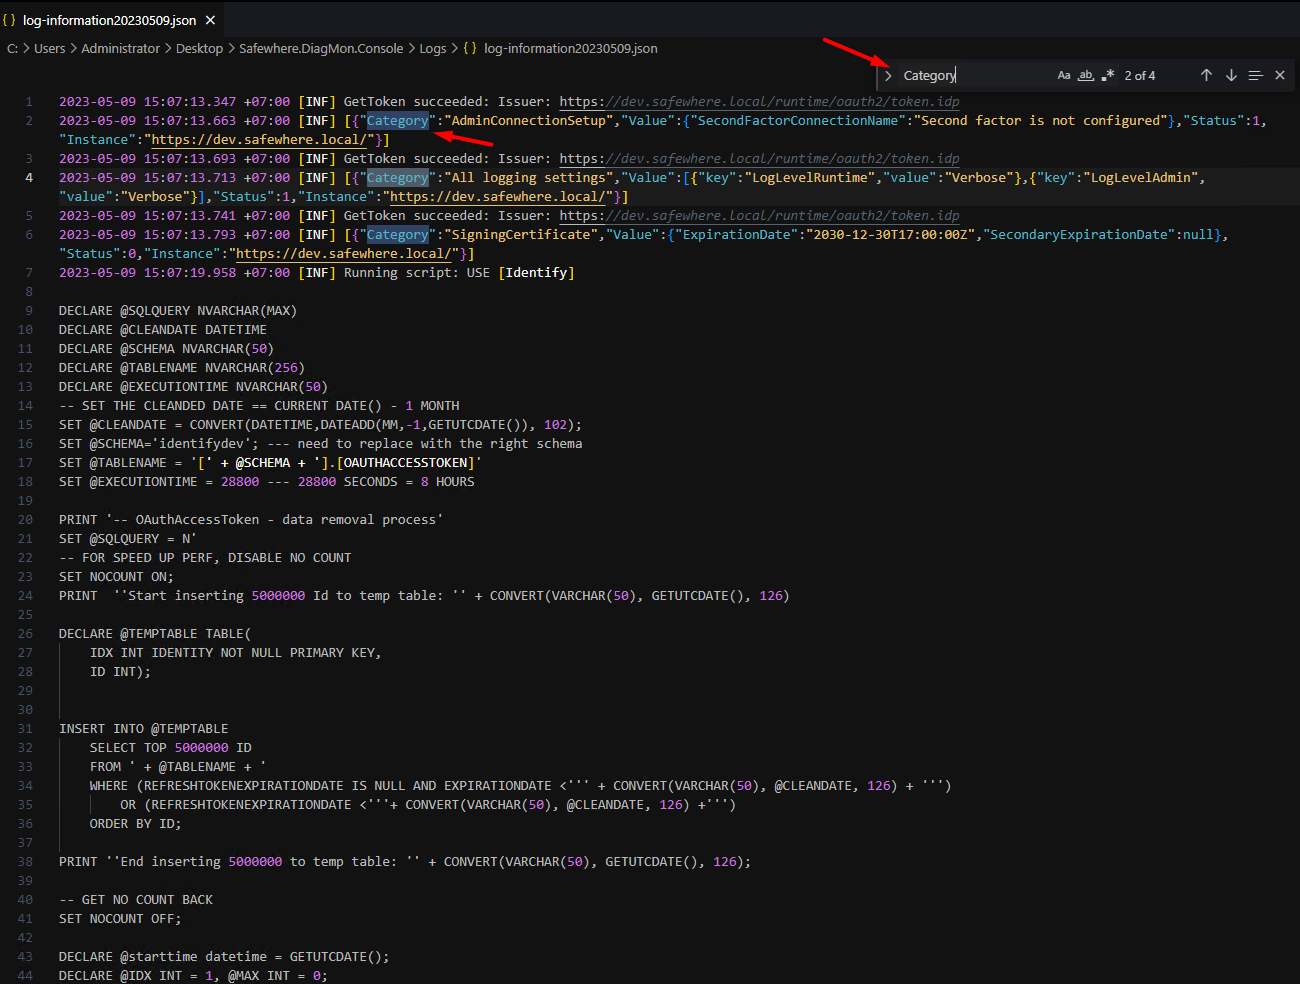
Interpreting the console output of the Diagnostics tool may be challenging, as it requires scrolling and searching for logs containing the keyword "Category".
Log files
If you've configured logging to write to a file, navigate to the directory specified in the appsettings file and open the log files. Look for the keyword 'Category' to locate pertinent information.
Application Insights
For a comprehensive view of Diagnostics and Monitoring results, access the configured Application Insights instance.
Application Insights offers visualizations for log results.
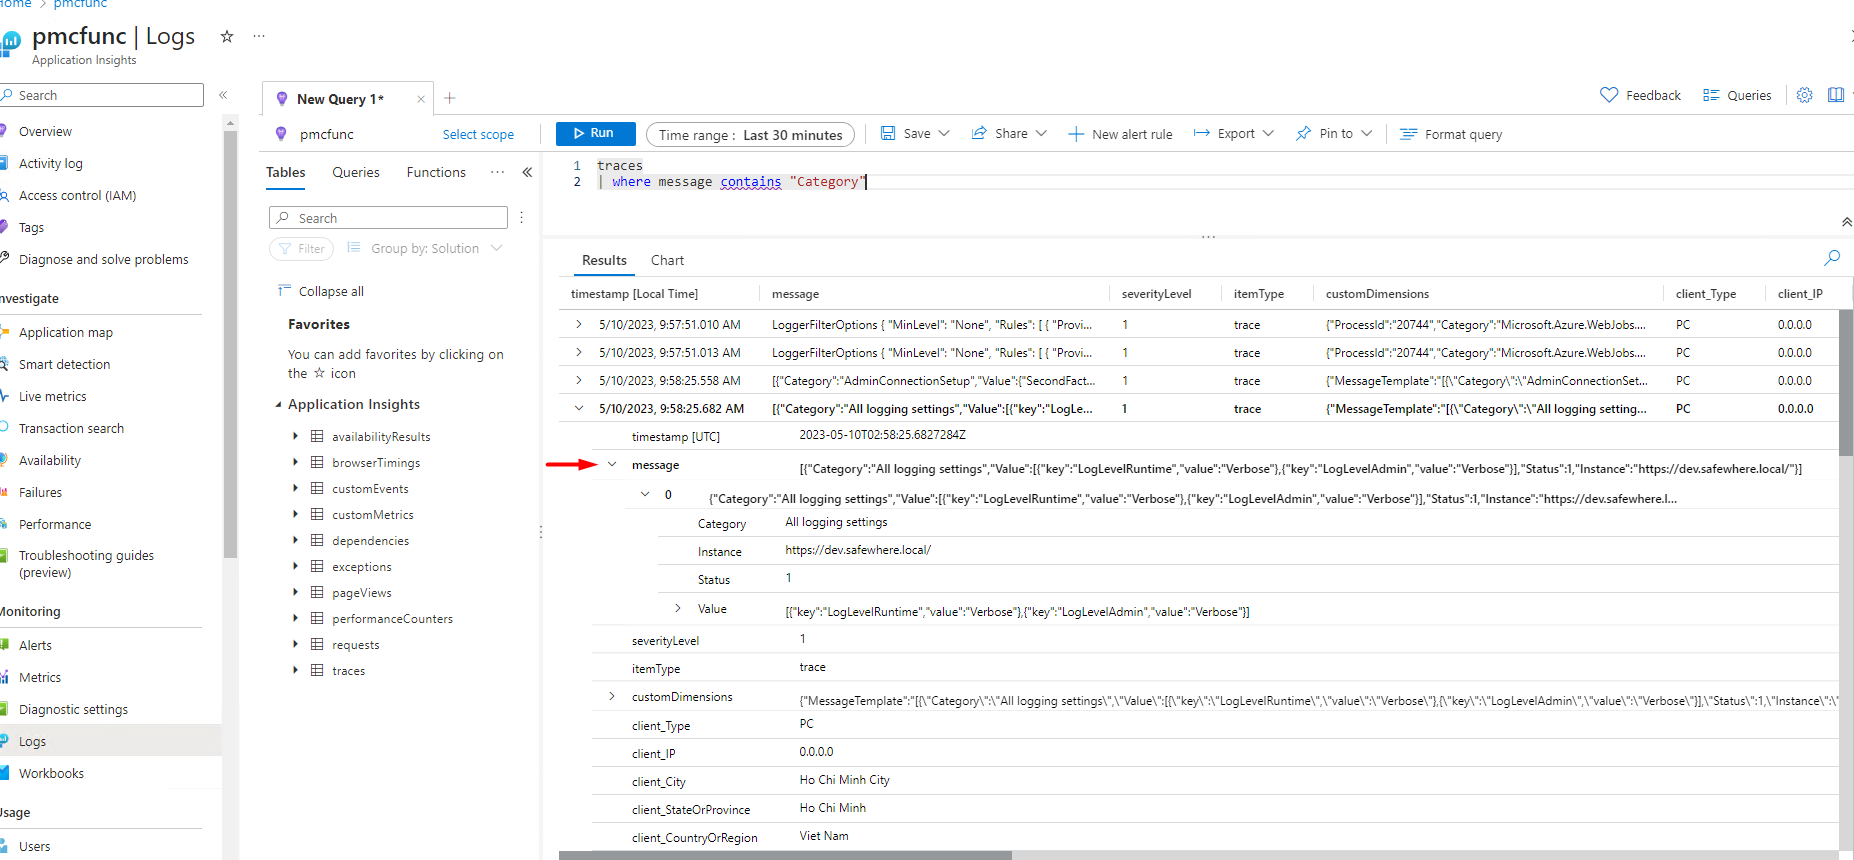
Navigate to Log and use the query:
traces
| where message contains "Category"
Inspect any log message by clicking on it to reveal details, including severity level, timestamp, category, message, and any custom properties added during logging. This detailed view assists in diagnosing issues or errors that may have arisen during diagnostics execution.
Case studies
Case study: Data analysis before tenant upgrade
The Diagnostics and Monitoring (DiagMon) tool can be used to verify and clean up data before upgrading a tenant. It provides insights into the current state of the database, including schema information, table sizes, and potential issues that may arise during the upgrade process. This case study demonstrates usage through the console.
Verify data to detect potential issues before upgrading a tenant
Navigate to the DiagMon-Console folder.
- Locate the following sections in the profile file and make the necessary updates:
"Using"section: Add"Serilog.Sinks.ApplicationInsights"to include the required logging sink."WriteTo"section: Update the ApplicationInsights connection string placeholder (INPUT-ApplicationInsights-CONNECTION-STRING) with your actual value."CompositeOptions"section: Ensure the database connection string placeholders ({INSERT-USERNAME}and{INSERT-PASSWORD}) are replaced with your actual database credentials for proper configuration.
File sample:
{
  "Serilog": {
    "Using": [
 ...
   "Serilog.Sinks.ApplicationInsights"


    ],
    ...
    "WriteTo": [
       {
        "Name": "ApplicationInsights",
        "Args": {
          "connectionString": "INPUT-ApplicationInsights-CONNECTION-STRING",
          "telemetryConverter": "Serilog.Sinks.ApplicationInsights.TelemetryConverters.TraceTelemetryConverter, Serilog.Sinks.ApplicationInsights"
        }
      },
      ...
    ],
    ...
  },
  ...
  "CompositeOptions": {
    "IdentifyEnvironmentOptions": [
      {
        //SQL Authentication
        "DatabaseConnectionString": "Server={SERVER_NAME};Initial Catalog=Identify;Persist Security Info=False;User ID={INSERT-USERNAME};Password={INSERT-PASSWORD};MultipleActiveResultSets=False;Encrypt=True;TrustServerCertificate=False;Connection Timeout=30;",
        "ConnectionName": "Identify",
        "DiagnosticsToRun": [ "DatabaseDiagnostics", "PotentialUpgradeIssue" ],
        "SqlQueriesToRun": [ "db_query_DatabaseSize.sql" ],
        "DiagnosticsOversized": {
          "MaxTableSizeInMB": 2000,
          "MaxTableRows": 5000
        }
      },
      {
        //SQL Authentication
        "DatabaseConnectionString": "Server={SERVER_NAME};Initial Catalog=IdentifyAudit;Persist Security Info=False;User ID={INSERT-USERNAME};Password={INSERT-PASSWORD};MultipleActiveResultSets=False;Encrypt=True;TrustServerCertificate=False;Connection Timeout=30;",
        "ConnectionName": "IdentifyAudit",
        "DiagnosticsToRun": [ "DatabaseDiagnostics", "PotentialUpgradeIssue" ],
        "SqlQueriesToRun": [ "db_query_DatabaseSize.sql" ],
        "DiagnosticsOversized": {
          "MaxTableSizeInMB": 2000,
          "MaxTableRows": 5000
        }
      }
    ],
    "IdentifyRestApiOptions": [

    ],
 ...
  }
}
- Use the following command to execute the DiagMon tool:
# Navigate to the directory where the DiagMon Console tool is located
path/to/Safewhere.DiagMon.Console.exe --profile <profile_name>
- Review the output to check for any anomalies related to the tenant before proceeding with the upgrade.
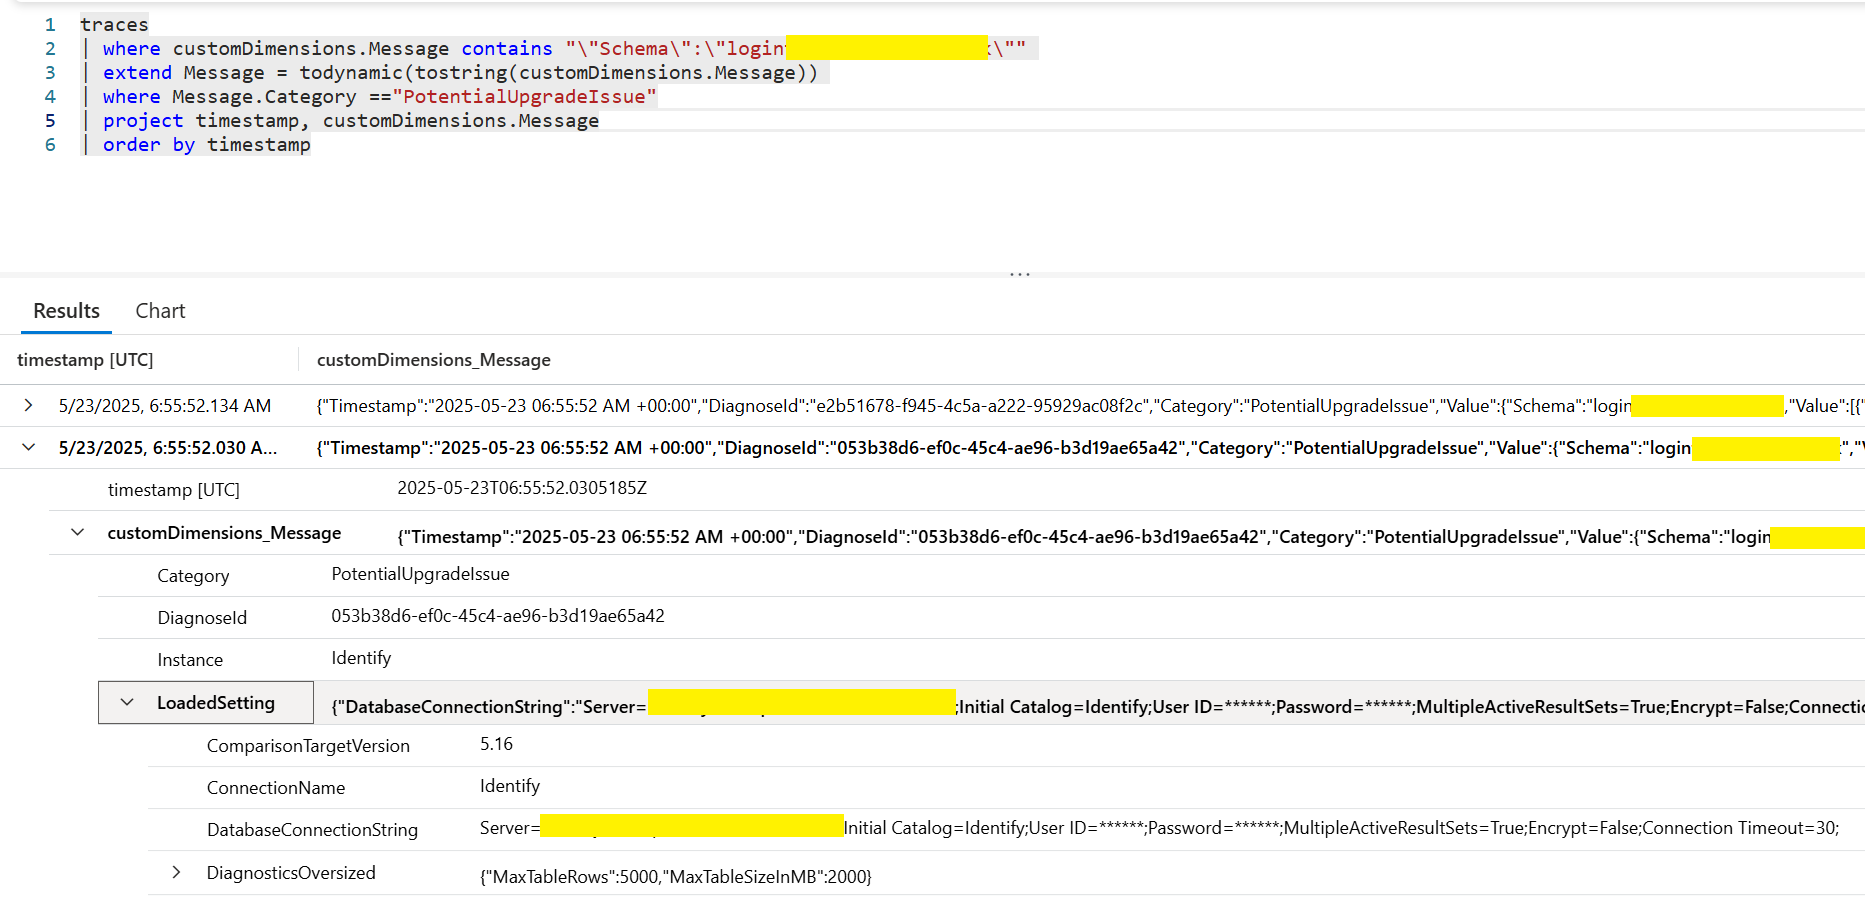
- Potential Upgrade Issue on specific tenant
traces
| where customDimensions.Message contains "\"Schema\":\"tenantSchema\""
| extend Message = todynamic(tostring(customDimensions.Message))
| where Message.Category =="PotentialUpgradeIssue"
| project timestamp, customDimensions.Message
| order by timestamp
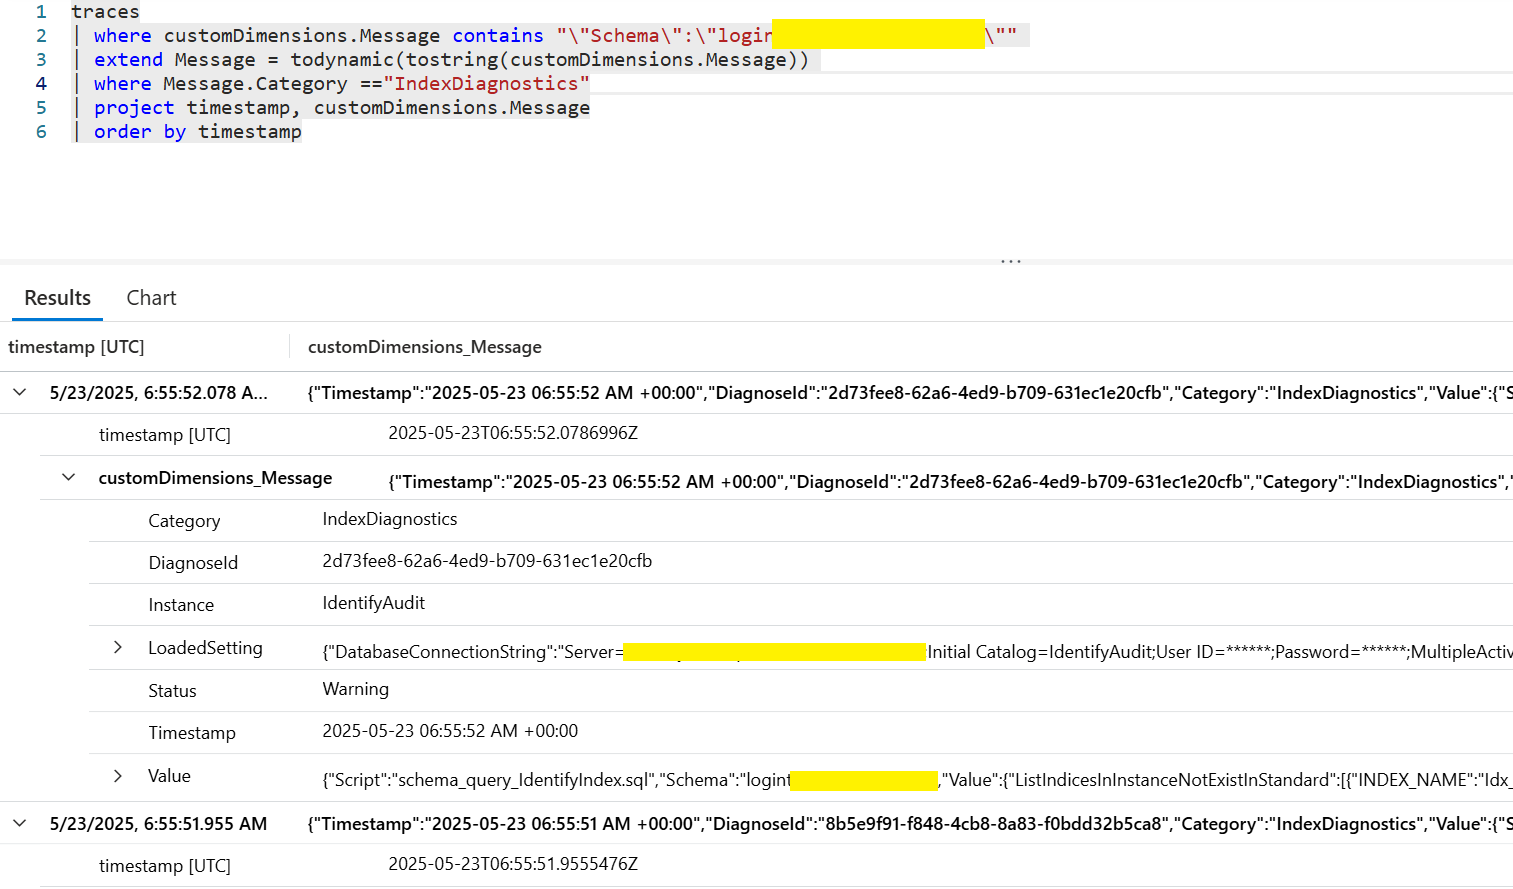
- Index diagnostics on specific tenant
traces
| where customDimensions.Message contains "\"Schema\":\"tenantSchema\""
| extend Message = todynamic(tostring(customDimensions.Message))
| where Message.Category =="IndexDiagnostics"
| project timestamp, customDimensions.Message
| order by timestamp
Clean up data before upgrading a tenant
In this step, we clean up the OAuthAccessToken and AuditOAuthAccessToken tables.
Index existence on the OAuthAccessToken table within the Identify database
Verify the existence of the IX_OAuthAccessToken__ExpirationDate_RefreshTokenExpirationDate index is present on the OAuthAccessToken table within the Identify database.
-- Update the name of the IX_OAuthAccessToken__ExpirationDate_RefreshTokenExpirationDate index
IF EXISTS(SELECT * FROM sys.indexes WHERE name = 'Idx_OAuthAccessToken__ExpirationDate_RefreshTokenExpirationDate' AND object_id = OBJECT_ID('[#SCHEMA].[OAuthAccessToken]'))
BEGIN

    EXEC sp_rename N'[#SCHEMA].[OAuthAccessToken].Idx_OAuthAccessToken__ExpirationDate_RefreshTokenExpirationDate', N'IX_OAuthAccessToken__ExpirationDate_RefreshTokenExpirationDate', N'INDEX';

END
GO

-- Check for the presence of the IX_OAuthAccessToken__ExpirationDate_RefreshTokenExpirationDate index
SELECT SCHEMA_NAME(T.SCHEMA_ID) + '.' + T.[NAME] AS TABLE_VIEW,I.[NAME] AS INDEX_NAME,I.is_disabled,
    SUBSTRING(COLUMN_NAMES, 1, LEN(COLUMN_NAMES)-1) AS [COLUMNS],
    I.type_desc AS INDEX_TYPE,
    CASE WHEN I.IS_UNIQUE = 1 THEN 'UNIQUE'
        ELSE 'NOT UNIQUE' END AS [UNIQUE],
    CASE WHEN T.[TYPE] = 'U' THEN 'TABLE'
        WHEN T.[TYPE] = 'V' THEN 'VIEW'
    END AS [OBJECT_TYPE]
FROM SYS.OBJECTS AS T
    INNER JOIN SYS.INDEXES AS I
        ON T.OBJECT_ID = I.OBJECT_ID
    CROSS APPLY (SELECT COL.[NAME] + ', '
            FROM SYS.INDEX_COLUMNS AS IC
            INNER JOIN SYS.COLUMNS AS COL
                ON IC.OBJECT_ID = COL.OBJECT_ID
                AND IC.COLUMN_ID = COL.COLUMN_ID
            WHERE IC.OBJECT_ID = T.OBJECT_ID
                AND IC.INDEX_ID = I.INDEX_ID
            ORDER BY COL.COLUMN_ID
    FOR XML PATH ('') ) AS D (COLUMN_NAMES)
WHERE T.IS_MS_SHIPPED <> 1
AND  SCHEMA_NAME(T.SCHEMA_ID)='#SCHEMA'
AND T.[NAME]='OAuthAccessToken'
AND I.[NAME]='IX_OAuthAccessToken__ExpirationDate_RefreshTokenExpirationDate'
AND INDEX_ID > 0
ORDER BY INDEX_NAME
If this index does not exist on this table, you can create a new one. (Note: Index building can have an impact on SQL Server performance. Therefore, it should be run when you believe there aren't many active users logging in.)
IF NOT EXISTS (SELECT * FROM sys.indexes WHERE object_id = OBJECT_ID(N'[#SCHEMA].[OAuthAccessToken]') AND name = N'IX_OAuthAccessToken__ExpirationDate_RefreshTokenExpirationDate')
BEGIN
CREATE NONCLUSTERED INDEX [IX_OAuthAccessToken__ExpirationDate_RefreshTokenExpirationDate] ON [#SCHEMA].[OAuthAccessToken]
   (
    [ExpirationDate] ASC,
       [RefreshTokenExpirationDate] ASC
   )
END
GO
Index existence on the AuditOAuthAccessToken table within the IdentifyAudit database
Ensure that the IX_AuditOAuthAccessToken__ExpirationDate_RefreshTokenExpirationDate index exists on the AuditOAuthAccessToken table within the IdentifyAudit database.
-- Update the name of the IX_AuditOAuthAccessToken__ExpirationDate_RefreshTokenExpirationDate index
IF EXISTS(SELECT * FROM sys.indexes WHERE name = 'Idx_AuditOAuthAccessToken__ExpirationDate_RefreshTokenExpirationDate' AND object_id = OBJECT_ID('[#SCHEMA].[AuditOAuthAccessToken]'))
BEGIN

    EXEC sp_rename N'[#SCHEMA].[AuditOAuthAccessToken].Idx_AuditOAuthAccessToken__ExpirationDate_RefreshTokenExpirationDate', N'IX_AuditOAuthAccessToken__ExpirationDate_RefreshTokenExpirationDate', N'INDEX';
END
GO
-- Check for the presence of the IX_AuditOAuthAccessToken__ExpirationDate_RefreshTokenExpirationDate index
SELECT SCHEMA_NAME(T.SCHEMA_ID) + '.' + T.[NAME] AS TABLE_VIEW,I.[NAME] AS INDEX_NAME,I.is_disabled,
    SUBSTRING(COLUMN_NAMES, 1, LEN(COLUMN_NAMES)-1) AS [COLUMNS],
    I.type_desc AS INDEX_TYPE,
    CASE WHEN I.IS_UNIQUE = 1 THEN 'UNIQUE'
        ELSE 'NOT UNIQUE' END AS [UNIQUE],
    SCHEMA_NAME(T.SCHEMA_ID) + '.' + T.[NAME] AS TABLE_VIEW,
    CASE WHEN T.[TYPE] = 'U' THEN 'TABLE'
        WHEN T.[TYPE] = 'V' THEN 'VIEW'
    END AS [OBJECT_TYPE]
FROM SYS.OBJECTS AS T
    INNER JOIN SYS.INDEXES AS I
        ON T.OBJECT_ID = I.OBJECT_ID
    CROSS APPLY (SELECT COL.[NAME] + ', '
            FROM SYS.INDEX_COLUMNS AS IC
            INNER JOIN SYS.COLUMNS AS COL
                ON IC.OBJECT_ID = COL.OBJECT_ID
                AND IC.COLUMN_ID = COL.COLUMN_ID
            WHERE IC.OBJECT_ID = T.OBJECT_ID
                AND IC.INDEX_ID = I.INDEX_ID
            ORDER BY COL.COLUMN_ID
    FOR XML PATH ('') ) AS D (COLUMN_NAMES)
WHERE T.IS_MS_SHIPPED <> 1
AND  SCHEMA_NAME(T.SCHEMA_ID)='#SCHEMA'
AND T.[NAME]='AuditOAuthAccessToken'
AND I.[NAME]='IX_AuditOAuthAccessToken__ExpirationDate_RefreshTokenExpirationDate'
AND INDEX_ID > 0
ORDER BY INDEX_NAME
GO
If this index does not exist on this table, you can create a new one. (Note: Index building can have an impact on SQL Server performance. Therefore, it should be run when you believe there aren't many active users logging in.)
IF NOT EXISTS (SELECT * FROM sys.indexes WHERE object_id = OBJECT_ID(N'[#SCHEMA].[AuditOAuthAccessToken]') AND name = N'IX_AuditOAuthAccessToken__ExpirationDate_RefreshTokenExpirationDate')
BEGIN
 CREATE NONCLUSTERED INDEX [IX_AuditOAuthAccessToken__ExpirationDate_RefreshTokenExpirationDate] ON [#SCHEMA].[AuditOAuthAccessToken]
    (
     [ExpirationDate] ASC,
        [RefreshTokenExpirationDate] ASC
    )
END
Execute the DiagMon tool for data cleanup
In the profile file, update the
"IdentifyEnvironmentOptions"section- Configure the database connection string placeholders (
{SERVER_NAME},{INSERT-USERNAME}and{INSERT-PASSWORD}) with your actual database credentials for data clean up. - DiagnosticsToRun setting: Set the
"DatabaseNonQuery"option.
This command executes clean up script starting with"schema_command"and runs them againstschema01andschema02, as specified in theIdentifyInstanceOptions.SqlCommandsToRunlist.
- Configure the database connection string placeholders (
Sample:
...
"IdentifyEnvironmentOptions": [
      {
        //Identify
        "DatabaseConnectionString": "Server={SERVER_NAME};Initial Catalog=Identify;Persist Security Info=False;User ID={INSERT-USERNAME};Password={INSERT-PASSWORD};MultipleActiveResultSets=False;Encrypt=True;TrustServerCertificate=False;Connection Timeout=30;",
        "ConnectionName": "Identify",
        "DiagnosticsToRun": [ "DatabaseNonQuery"  ],
        "SqlQueriesToRun": [ "" ],
        "DiagnosticsOversized": {
          "MaxTableSizeInMB": 2000,
          "MaxTableRows": 5000
        },
        "IdentifyInstanceOptions": [
           {
            "Schema": "schema01",
            "SqlCommandsToRun": [
              {
                "Command": "schema_command_OauthAccessTokenCleanUp.sql",
    "BatchSize": 10000,
    "CommandTimeoutInSeconds": 14400, //14400 SECONDS = 4 HOURS
    "MaxEvents": 300000
              }
            ]
          },
          {
            "Schema": "schema02",
            "SqlCommandsToRun": [
              {
                "Command": "schema_command_OauthAccessTokenCleanUp.sql",
    "BatchSize": 10000,
    "CommandTimeoutInSeconds": 14400, //14400 SECONDS = 4 HOURS
    "MaxEvents": 300000
              }
            ]
          }
        ]
      },
      {
        //IdentifyAudit
        "DatabaseConnectionString": "{SERVER_NAME};Initial Catalog=IdentifyAudit;Persist Security Info=False;User ID={INSERT-USERNAME};Password={INSERT-PASSWORD};MultipleActiveResultSets=False;Encrypt=True;TrustServerCertificate=False;Connection Timeout=30;",
        "ConnectionName": "IdentifyAudit",
        "DiagnosticsToRun": [ "DatabaseNonQuery"  ],
        "SqlQueriesToRun": [ "" ],
        "DiagnosticsOversized": {
          "MaxTableSizeInMB": 2000,
          "MaxTableRows": 5000
        },
        "IdentifyInstanceOptions": [
           {
            "Schema": "schema01",
            "SqlCommandsToRun": [
              {
                "Command": "schema_command_AuditOauthAccessTokenCleanUp.sql",
    "BatchSize": 10000,
    "CommandTimeoutInSeconds": 14400, //14400 SECONDS = 4 HOURS
    "MaxEvents": 300000
              }
            ]
          },
          {
            "Schema": "schema02",
            "SqlCommandsToRun": [
              {
                "Command": "schema_command_AuditOauthAccessTokenCleanUp.sql",
    "BatchSize": 10000,
    "CommandTimeoutInSeconds": 14400, //14400 SECONDS = 4 HOURS
    "MaxEvents": 300000
              }
            ]
          }
        ]
      }
    ]
...
- Use the following command to execute the DiagMon tool:
# Navigate to the directory where the DiagMon Console tool is located
path/to/Safewhere.DiagMon.Console.exe --profile <profile_name>
- Execute the DiagMon tool using the specified profile to verify data integrity after cleanup.
Case study: Detect tenant version mismatch
This case study demonstrates how to use the DiagMon tool to identify and diagnose version mismatches across tenants in your Identify environment. Version inconsistencies can lead to unexpected behavior and compatibility issues, making it essential to detect them early.
Console application configuration
To run the command in a console application, configure the appsettings.json file as follows.
SQL authentication
Here's a sample appsettings.json configuration using SQL Authentication:
{
  "Serilog": {
    // Refer to the documentation for more information on configuring Serilog: https://docs.safewhere.com/identify/operations/diagnostics-and-monitoring-tool.html#logging-configuration
  },
  "CompositeOptions": {
    "IdentifyEnvironmentOptions": [
      {
        "DatabaseConnectionString": "Server=<SERVER_NAME>;Database=IdentifyTenant;uid=<USER_ID>;pwd=<PASSWORD>;MultipleActiveResultSets=true;MultiSubnetFailover=False;Encrypt=False;",
        "DiagnosticsToRun": [ "DetectTenantVersionMisMatch" ]
      }
    ]
  }
}
Windows authentication
If you're using Windows Authentication, use the following connection string instead:
Server=<SERVER_NAME>; Database=IdentifyTenant; Trusted_Connection=True; MultipleActiveResultSets=true;MultiSubnetFailover=False;Encrypt=False
Azure Function configuration
To run the command in an Azure Function, configure the settings as follows.
Sample Configuration (pre-base64 encode):
{
  "CompositeOptions": {
    "IdentifyEnvironmentOptions": [
      {
        "DatabaseConnectionString": "#IDENTIFY_TENANT_AZURE_CONNECTION_STRING#",
        "DiagnosticsToRun": [ "DetectTenantVersionMisMatch" ]
      }
    ]
  }
}
Replace #IDENTIFY_TENANT_AZURE_CONNECTION_STRING# with the connection string for your IdentifyTenant database on Azure.
Diagnostic output
After the command completes, a diagnostic report will be generated. The output will appear the same for both the console application and Azure Function. Here's an example output:
{
    "Timestamp": "2026-06-22 09:09:43 AM +00:00",
    "DiagnoseId": "aa75dbfe-767d-4906-869e-99011496cdc2",
    "Category": "DetectTenantVersionMisMatch",
    "Value": [
        {
            "Name": "tenantonazure",
            "IsVersionMatched": true,
            "NumberOfReplicateInstances": 1,
            "PrimaryTenant": {
                "Version": "5.19.0.75",
                "ConfiguratorId": "cbd84220-75ac-40af-a2e7-cf69718891f7"
            },
            "ReplicateTenants": [
                {
                    "Version": "5.19.0.75",
                    "ConfiguratorId": "98431afc-10a7-46ee-8aa4-571cd29e5903"
                }
            ]
        },
        {
            "Name": "tenantonazure001",
            "IsVersionMatched": true,
            "NumberOfReplicateInstances": 0,
            "PrimaryTenant": {
                "Version": "5.19.0.75",
                "ConfiguratorId": "cbd84220-75ac-40af-a2e7-cf69718891f7"
            },
            "ReplicateTenants": []
        },
        {
            "Name": "tenantonazure002",
            "IsVersionMatched": false,
            "NumberOfReplicateInstances": 2,
            "PrimaryTenant": {
                "Version": "5.19.0.75",
                "ConfiguratorId": "cbd84220-75ac-40af-a2e7-cf69718891f7"
            },
            "ReplicateTenants": [
                {
                    "Version": "5.19.0.75",
                    "ConfiguratorId": "98431afc-10a7-46ee-8aa4-571cd29e5903"
                },
                {
                    "Version": "5.19.0.66",
                    "ConfiguratorId": "65c713ec-b2c6-4833-ad94-50711235d3a4"
                }
            ]
        }
    ],
    "Status": "Normal",
    "LoadedSetting": {
        "DatabaseConnectionString": "Server=tcp:dqtmssql.database.windows.net,1433;Initial Catalog=IdentifyTenant;Persist Security Info=False;User ID=******;Password=******;MultipleActiveResultSets=False;Encrypt=True;TrustServerCertificate=False;Connection Timeout=30;",
        "DiagnosticsToRun": [
            "DetectTenantVersionMisMatch"
        ],
        "DiagnosticsOversized": {}
    }
}
Output explanation
- "IsVersionMatched": true → The primary tenant's version matches all replicate tenant versions.
- "IsVersionMatched": false → At least one replicate tenant has a different version than the primary tenant.
- "NumberOfReplicateInstances" → Total number of replicate tenants found for this tenant.
- ConfiguratorId → Identifier for the configurator associated with the tenant version.